Syntax
The ezsurf() function has different syntaxes that are given below:
Here,
The function ezsurf(f) creates a plot of two variables or the symbolic function f(x,y) over the range -2*pi<x<2*pi and -2*pi<y<2*pi.
The function ezsurf(f,[xmin,xmax]) creates a plot of two variables or symbolic function f(x,y) over the specified range xmin<x<xmax.
The function ezsurf(f,[xmin,xmax,ymin,ymax]) creates a plot of two variables or symbolic function f(x,y) over the specified range xmin<x<xmax and ymin<y<ymax.
The function ezsurf(x,y,z) creates the parametric surface’s plots x = x(s,t), y = y(s,t), and z = z(s,t) over the default range -2*pi < s < 2*pi, -2*pi < t < 2*pi.
The function ezsurf(x,y,z,[smin,smax]) creates the parametric surface’s plots x = x(s,t), y = y(s,t), and z = z(s,t) over the specified range smin < s < smax.
The function ezsurf(___,’circ’) creates an ezsurf plot over the disc by mentioning circ after the input arguments used in the previous syntaxes.
Examples
To understand the working of the ezsurf() function in MATLAB, consider some examples.
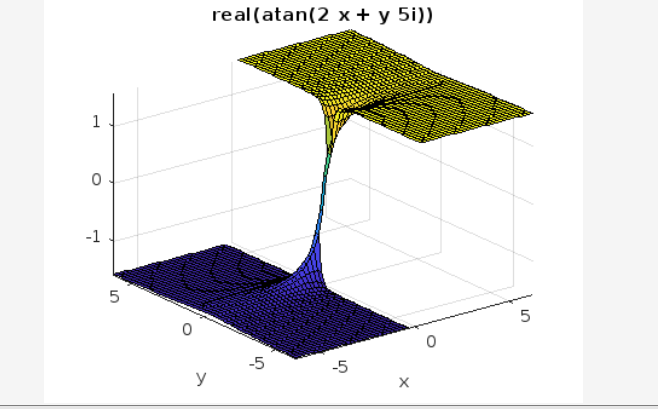
Example 1: How to Create Surface Plot in MATLAB Using the ezsurf(f) Function?
This example creates the surface plot for the given function f(x,y) over the default range -2*pi<x<2*pi using the ezsurf(f) function.
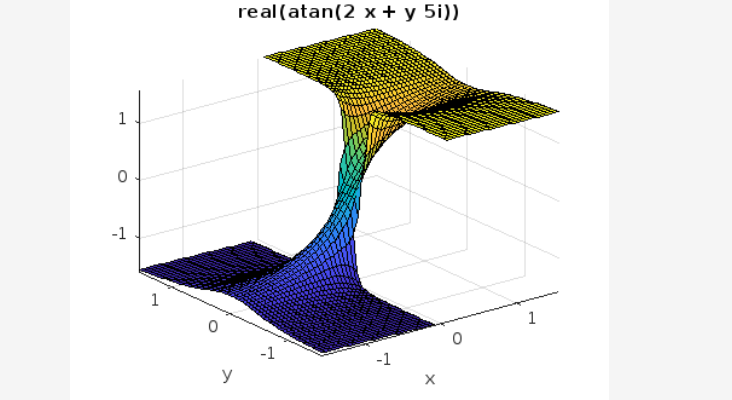
Example 2: How to Create Surface Plot in MATLAB Using the ezsurf(f, [xmin, xmax]) Function?
This example uses the ezsurf(f,[xmin,xmax]) function to plot surface plots for the given function f(x,y).
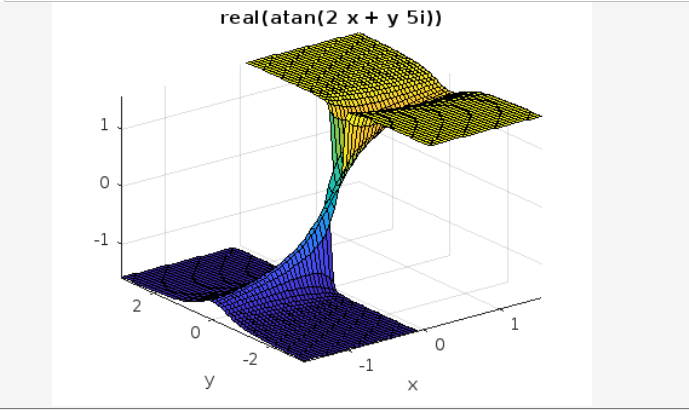
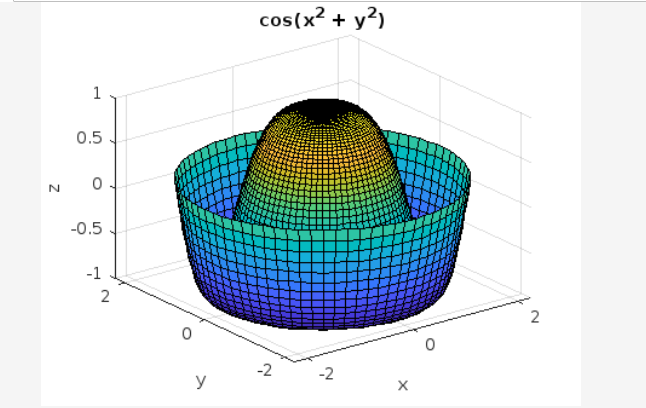
Example 3: How to Create Surface Plot in MATLAB Using the ezsurf(f,[xmin,xmax,ymin,ymax]) Function?
In the given example, we plot the surface plots for the given function f(x,y) using the ezsurf(f,[xmin,xmax,ymin,ymax)] function.
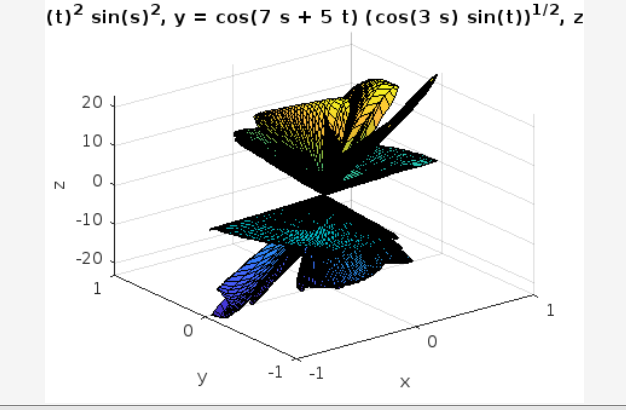
Example 4: How to Create Surface Plot in MATLAB Using the ezsurf(x,y,z,[smin,smax]) Function?
In this MATLAB code, we create the surface plot for the given parametric equations using the ezsurf(x,y,z,[smin,smax]) function.
Example 5: How to Create Surface Plot in MATLAB Using the ezsurf(___,’circ’) Function?
This example illustrates the functionality of the ezsurf() function by creating the disc over the given range.
Conclusion
The ezsurf() function in MATLAB is a powerful tool for creating colored surface plots and can be used to plot both real and complex-valued functions. The syntax for the ezsurf() function is simple and easy to understand. If you need to create a colored surface plot in MATLAB, the ezsurf() function is a great option. This tutorial has provided a brief overview of different syntaxes of the ezsurf() function and presented examples for each case to help you understand the basics of this function in MATLAB.