A histogram is a kind of bar plot that is used for grouping numerical data into bins. After creating a histogram object, you can modify its properties to change different parts of the histogram. This is very helpful for fast-changing the display or the bins’ attributes. The main objective of this article is to explore how to customize a histogram in MATLAB.
How to Customize a Histogram in MATLAB?
A histogram can be created by using the given syntax:
histogram(x,nbins)
histogram(x,edges)
Here:
histogram(x) generates a histogram plot of x. The histogram function employs an automatic binning mechanism that generates bins with consistent widths, chosen that cover the range of elements in x & display the distribution’s basic shape. The height of each rectangle in the histogram’s representation of the bins reflects how many elements are contained within each bin.
histogram(x,nbins) uses the nbins scalar, which indicates how many bins to use.
histogram(x,edges) divides x into bins according to the edges of each bin as defined by the edges vector. Except for the final bin, which has both edges, each bin only contains the left edge.
Example
The given MATLAB code generates a vector of 1500 random numbers and creates a histogram using the histogram() function that takes the defined vector x as an input. The histogram() function automatically determines the right number of bins to display the underlying distribution’s form and cover the range of values in x.
histogram(x)
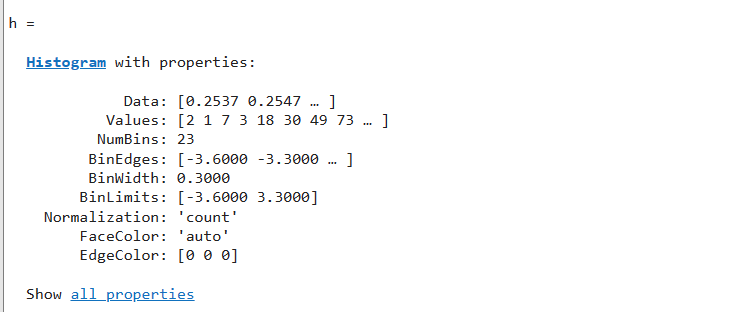
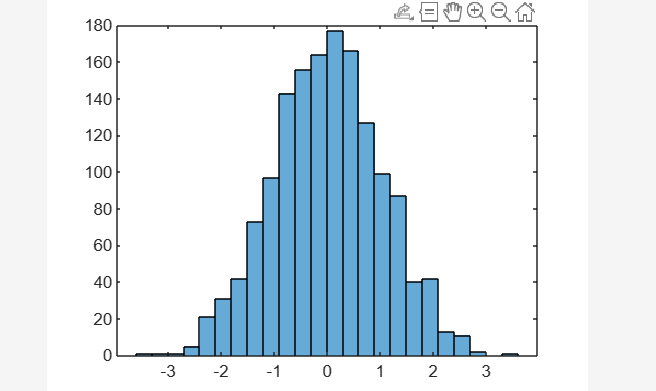
The histogram function generates a histogram object when you pass it an output argument. The histogram’s attributes, like the number of bins and bin width, can be examined using this object.
How to Specify the Number of Histogram Bins?
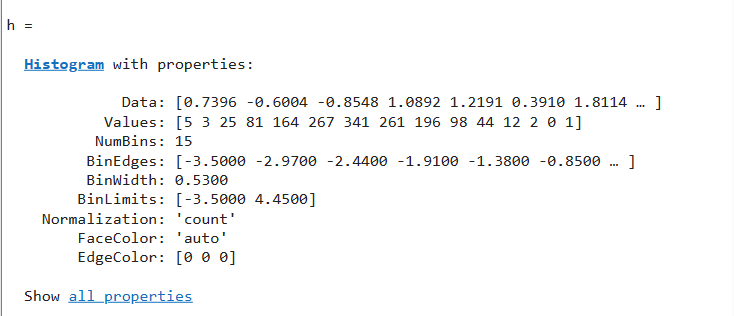
The given MATLAB code creates a histogram divided into 15 equally spaced bins by specifying the number of bins in the histogram() function.
histogram(x,15);
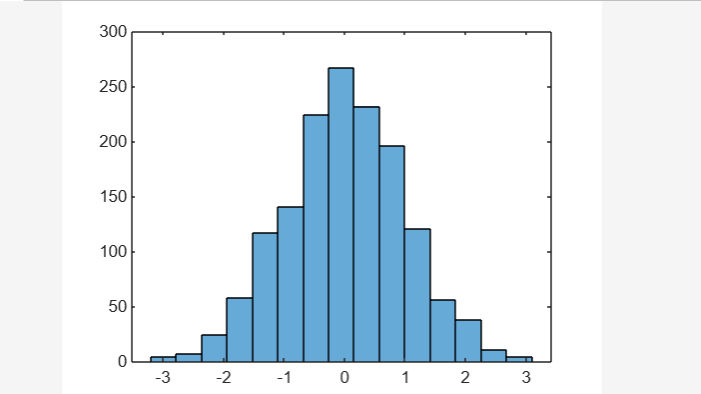
How to Find the Bin Counts?
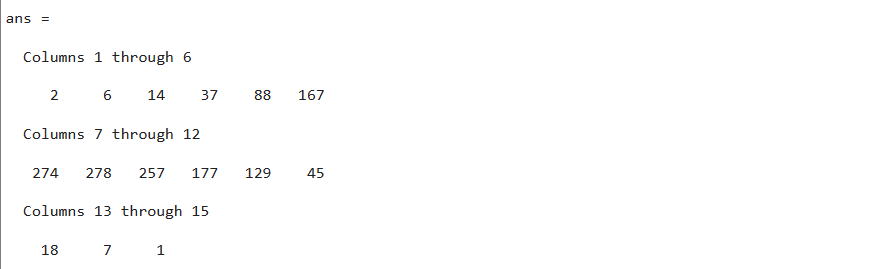
The given MATLAB code finds the value of each histogram bin. Values that will create a vector having a length equal to the number of bins.
h = histogram(x, 15);
h.Values
How to Specify the Bin Edges of Histogram?
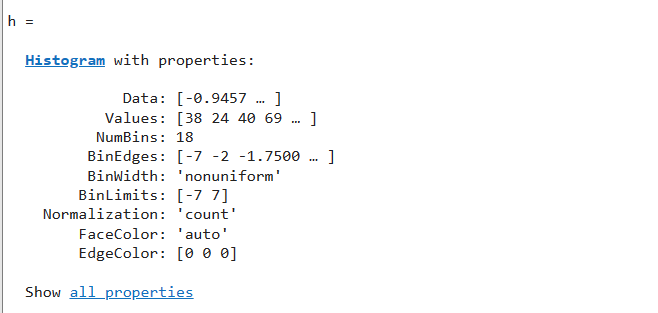
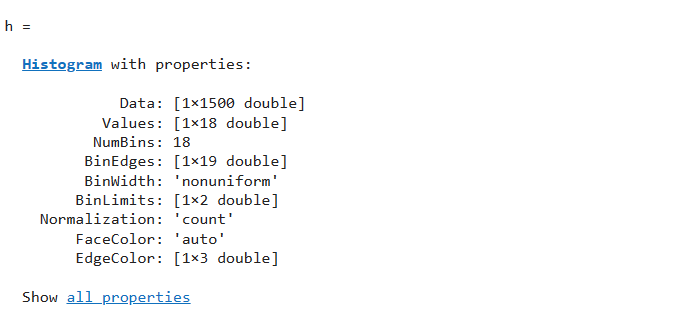
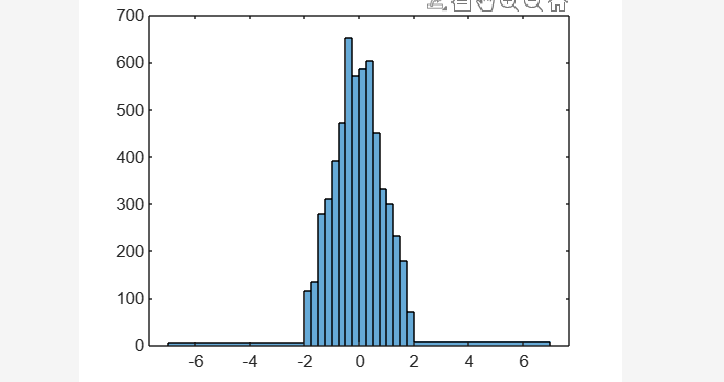
This MATLAB code creates a histogram and specifies a bin edges vector having many bins on the histogram’s edges for capturing the outliers that don’t satisfy ∣x∣<2. Here, the left edge of the first bin serves as the first element of the vector, and the right edge of the last bin serves as the last element of the vector.
edges = [-7 -2:0.25:2 7];
h = histogram(x,edges)

To smooth out the bins holding the outliers, specify “countdensity” as the normalization property. The frequency of observations in each interval is now represented by the area of each bin rather than its height.
edges = [-7 -2:0.25:2 7];
h = histogram(x,edges)
h.Normalization = 'countdensity';
Conclusion
A histogram is a kind of bar plot that is used for grouping numerical data into bins. Once a histogram object has been created, you can adjust its properties to customize various aspects of the histogram. In this guide, we learned how to customize a histogram in MATLAB using various techniques such as specifying and finding the number of bins and edges.