In this guide, we will learn how to create a surfc plot in MATLAB using different examples.
What is a Surfc Plot in MATLAB?
A surfc plot is a contour plot that allows us to depict f(x, y, z) in three-dimensional spaces under the surface plot. We can create these plots in MATLAB using MATLAB’s built-in surfc() function. This function is used for creating three-dimensional plots having solid face and edge colors in MATLAB. This function accepts the values of X, Y, and Z as arguments and creates a three-dimensional surfc plot that represents the function’s behavior in the form z = f(x, y).
Syntax
The surfc() function uses the simple syntax in MATLAB:
Here:
The function surfc(X, Y, Z) creates a three-dimensional surface plot having the contour plot underneath with solid face and edge colors where matrix Z represents a height above the x-y plane and matrices X and Y represent the x-y plane.
The function surfc(X, Y, Z, C) creates the contour plot under the surface plot by specifying the additional colors.
The function surfc(Z) produces a surface plot with the contour using matrix Z by utilizing column as well as row indices as the respective x and y coordinates.
The function surfc(Z, C) yields to specify the additional edges’ colors.
How to Create Surface Contour Plots in MATLAB Using the surfc() Function?
Follow the given three steps to create contour under the surface plots in MATLAB using the surfc() function.
Step 1: Create a mesh grid in the xy-plane utilizing the meshgrid() function that covers the domain of the given function.
Step 2: Compute the value of the specified function for each point in the created mesh grid.
Step 3: Draw the function z = f(x, y) utilizing the surfc() function.
Examples
Consider some examples to understand the surfc() function’s working.
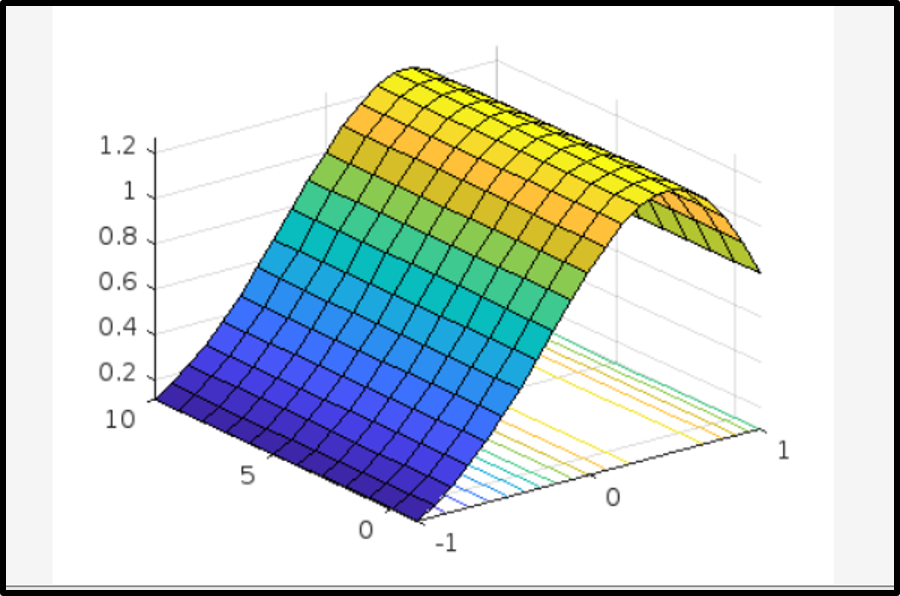
Example 1: How to Create Surface Contour Plot Using the surfc(X,Y,Z) Function?
The given example creates a contour under the surface plot for the function Z = exp(X).*cos(X).^2 using the surfc(X, Y, Z) function.
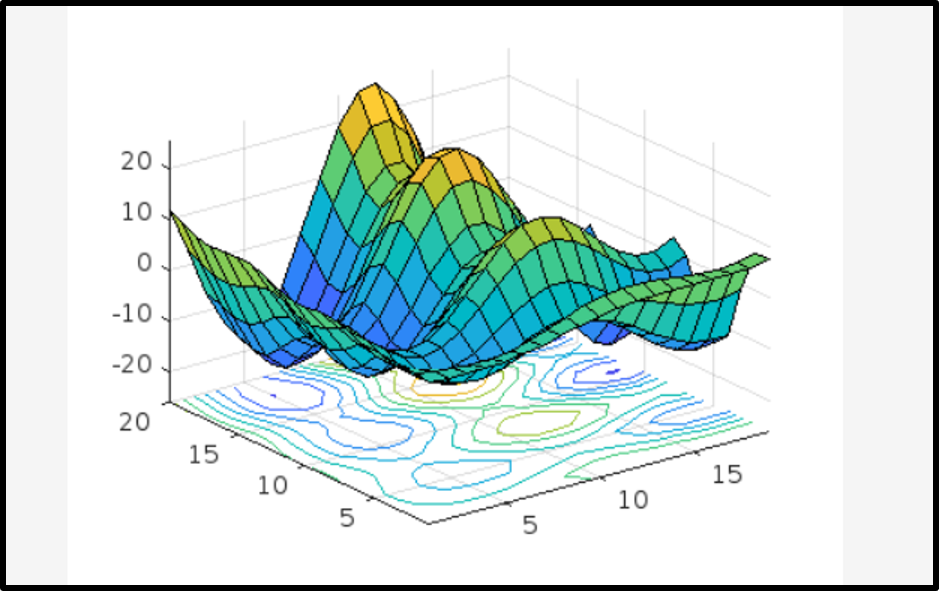
Example 2: How to Create Surface Contour Plot Using the surfc(Z) Function?
This example describes the working of the surfc(Z) function to generate a contour under the surface plot for the given function.
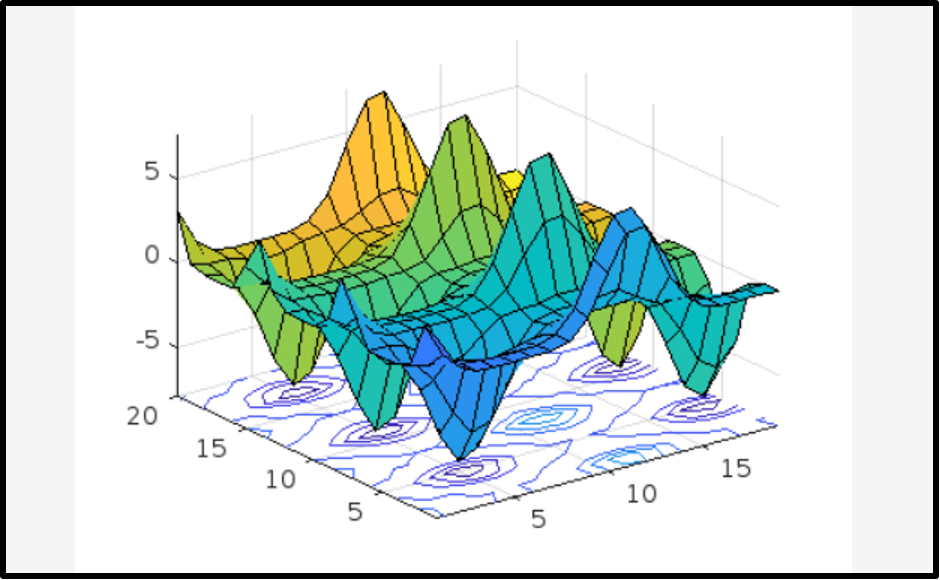
Example 3: How to Create Surface Contour Plot Using the surfc(Z,C) Function?
This MATLAB code explains how to specify the different colors in the surfc plot using the surfc(Z, C) function where C represents the colormap.
Conclusion
MATLAB is a useful programming tool that allows us to create different plots of different types using built-in functions. It provides us with the surfc() function which is used for making contours under the surface plots that have solid face and edge colors. This function accepts one or more mandatory and optional arguments and generates a surfc plot for the given function. This guide described the functionality of the surfc() function using some examples, allowing you to create your surfc plots in MATLAB.