Throughout data processing and analysis, histograms support you to represent frequency distribution and gain insights easily. We’ll look at a few various methods for obtaining frequency distribution in PostgreSQL. To build a histogram in PostgreSQL, you can use a variety of PostgreSQL Histogram commands. We will explain each one separately.
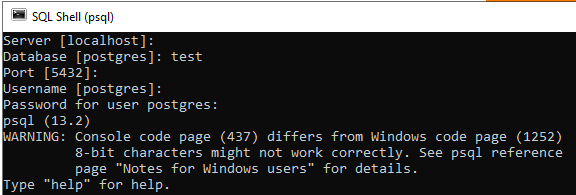
Initially, make sure you have PostgreSQL command-line shell and pgAdmin4 installed in your computer system. Now, open the PostgreSQL command-line shell to start working on histograms. It will immediately ask you to enter the Server name which you want to work on. By default, the ‘localhost’ server has been selected. If you don’t enter one while jumping to the next option, it will carry on with the default. After that, it will prompt you to enter the Database name, port number, and username to work on. If you don’t provide one, it will continue with the default one. As you can view from the image appended below, we will be working on the ‘test’ database. At last, enter your password for the particular user and get ready.
Example 01:
We must have some tables and data in our database to work on. So we have been creating a table ‘product’ in the database ‘test’ to save the records of different product sales. This table occupies two columns. One is ‘order_date’ to save the date when the order has been done, and the other is ‘p_sold’ to save the total number of sales on a particular date. Try the below query in your command-shell to create this table.
Right now, the table is empty, so we have to add some records to it. So, try the below INSERT command in the shell to do so.
Now you can check that the table has got data into it using the SELECT command as cited below.
Use of Floor and Bin:
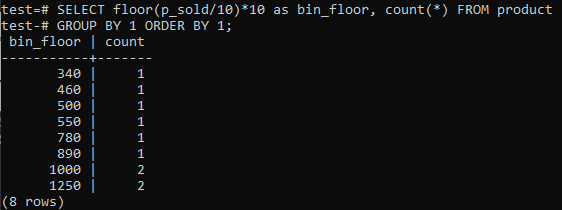
If you like PostgreSQL Histogram bins to provide similar periods (10-20, 20-30, 30-40, etc.), run the SQL command below. We estimate the bin number from the below statement by splitting the selling value by a histogram bin size, 10.
This approach has the benefit of dynamically changing the bins as data is added, deleted, or modified. It also adds additional bins for new data and/or deletes bins if their count reaches zero. As a result, you can generate histograms efficiently in PostgreSQL.
Changeover floor(p_sold/10)*10 with floor(p_sold/100)*100 for increasing the bin size up to 100.
Using WHERE Clause:
You will construct a frequency distribution utilizing CASE declaration while you understand the histogram bins to be generated or how the histogram container sizes vary. For PostgreSQL, below is another Histogram statement:
And the output shows the histogram frequency distribution for the total range values of column ‘p_sold’ and the count number. Prices range from 300-600 and 900-1300 has a total count of 4 separately. The sale range of 600-900 got 2 counts while range 100-300 got 0 counts of sales.
Example 02:
Let’s consider another example for illustrating histograms in PostgreSQL. We have created a table ‘student’ by using the cited below command in the shell. This table will store the information regarding students and the count of fail numbers they have.
The table must have some data in it. So we have executed the INSERT INTO command to add data in the table ‘student’ as:
Now, the table has been filled with an enormous amount of data as per the output displayed. It has random values for std_id and the fail_count of students.
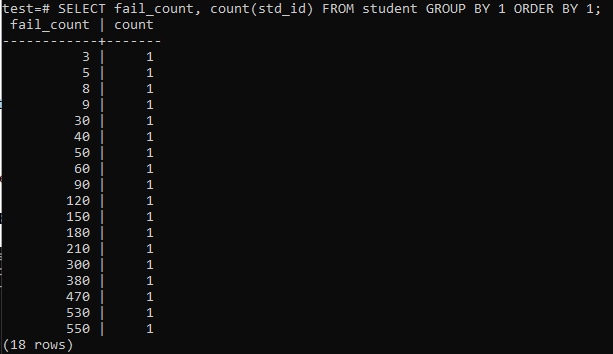
When you try to run a simple query to collect the total counts of failures one student has, then you will have the below-stated output. The output only shows the separate number of fail counts of every student once from the ‘count’ method used on the column ‘std_id’. This looks not very satisfying.
We will be using the floor method again in this instance for similar periods or ranges. So, execute the below-stated query in the command shell. The query divides the students ‘fail_count’ by 100.00 and then applies the floor function to create a bin of size 100. Then it sums-up the total numbers of students residing in this particular range.
Conclusion:
We can generate a histogram with PostgreSQL using any of the techniques mentioned earlier, reliant upon the requirements. You can alter the histogram buckets to every range you wish; uniform intervals aren’t required. Throughout this tutorial, we tried to explain the best examples to clear your concept regarding histogram creation in PostgreSQL. I hope, by following any of these examples, you can conveniently create a histogram for your data in PostgreSQL.


