A heatmap chart is a two-dimensional data visualization plot used for indicating individual data points within a dataset as a color. Each color corresponding to each value of the data set can vary by hue or intensity. The heatmap charts help us design large and complex data. To create a heatmap chart of large data sets, MATLAB facilitates us with a built-in heatmap() function.
Read this guide to find out how to create a heatmap chart in MATLAB.
Why Do We Need Heatmap Chart in MATLAB?
Heatmap charts are useful for visualizing 2D data, such as time and space, or two different variables. They are used for patterns and trends identification in data that you are hardly able to find on other charts like bars or lines. Thus, it is one of the most effective and useful charts that help you see the data concisely.
How to Create Heatmap Chart in MATLAB?
The heatmap chart of small or large data sets can be easily created using the heatmap() function. This function takes some necessary and optional parameters and creates a heatmap chart in MATLAB accordingly.
Syntax
The heatmap() function uses different syntaxes to create heatmap charts that are given below:
heatmap(tbl,xvar,yvar,'ColorVariable',cvar)
heatmap(cdata)
heatmap(xvalues,yvalues,cdata)
Here,
The function heatmap(tbl,xvar,yvar) creates a heatmap chart from the given table tbl where xvar represents the table variables to display along the x-axis while the yvar represents the table variables to display along the y-axis.
The function heatmap(tbl,xvar,yvar,’ColorVariable’,cvar) yields to creation of a heatmap chart from the given table tbl using the data cvar to compute the color data. The mean aggregation is the default calculation method.
The function heatmap(cdata) yields to creation of the heatmap chart from the given matrix cdata. Each cell of the heatmap chart represents the value of cdata.
The function heatmap(xvalues,yvalues,cdata) is responsible for specifying the x-axis and y-axis values labels.
Example
Consider some examples to practically understand the implementation of the heatmap() function in MATLAB.
Example 1: How to Create a Heatmap Chart Using the Tabular Data in MATLAB?
In this MATLAB code, we use the heatmap() function to create a heatmap chart corresponding to the given variables from the specified data set in MATLAB.
tbl = table(LastName,Age,Gender,SelfAssessedHealthStatus,...
Smoker,Weight,Location);
h = heatmap(tbl,'Gender','SelfAssessedHealthStatus');

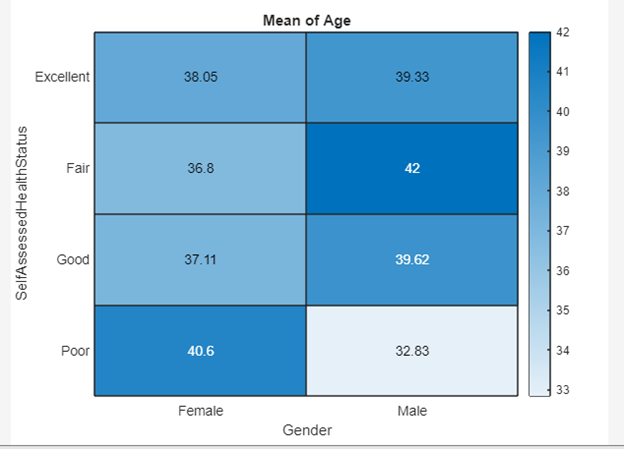
Example 2: How to Create a Heatmap Chart by Specifying Table Values for Heat Map Colors in MATLAB?
The given example creates a heatmap chart from the given data set by specifying the Age variable for heatmap colors in MATLAB using the heatmap() function.
tbl = table(LastName,Age,Gender,SelfAssessedHealthStatus,...
Smoker,Weight,Location);
h = heatmap(tbl,'Gender','SelfAssessedHealthStatus', 'ColorVariable','Age');
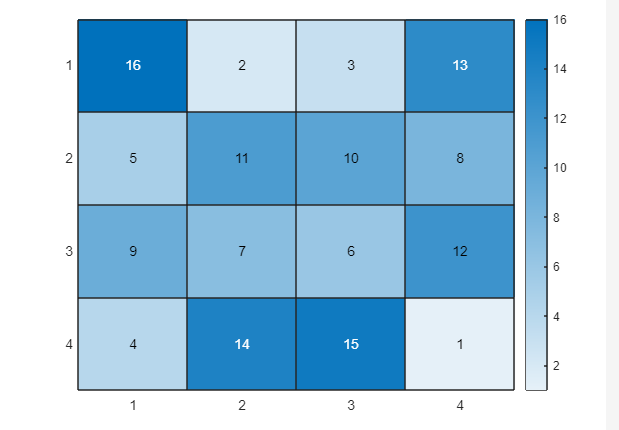
Example 3: How to Create a Heatmap Using Matrix Data in MATLAB?
In the given example, we create a heatmap chart for the given matrix A.
heatmap(A)
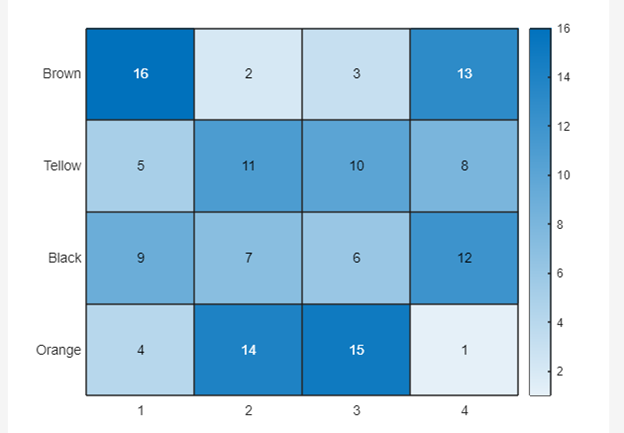
Example 4: How to Create a Heat Map Chart from Matrix Data Using Axes Labels in MATLAB?
In the MATLAB code, we use the heatmap() function to create a heatmap chart from the matrix data using the axes labels.
xvalues = {'1','2','3', '4'};
yvalues = {'Brown','Tellow','Black','Orange'};
h = heatmap(xvalues,yvalues,A);
Conclusion
A heatmap chart is a two-dimensional data visualization that indicates each value in the data set by a color. These charts are used to design large and complex data. The colors may vary by intensity or hue. MATLAB provides us with a built-in heatmap() function to create a heatmap chart in MATLAB. This guide has provided in detail the working of the heatmap() function where you will find why it is useful and how it can be implemented in MATLAB.