MATLAB is a high-performance computing tool that allows us to perform data visualization. When we execute any graphic command, it automatically opens the figure window that contains the created graph. However, for some visualization problems, we need to open the figure window manually. This task can be easily done using MATLAB’s built-in figure() function.
If you are not familiar with the working of the figure() function to create a figure window in MATLAB, you need to follow this guide thoroughly.
Why is it Important to Create a Figure Window in MATLAB?
Creating a figure window is important in MATLAB because it allows us to visualize data and results, helping us to customize them, such as changing their fonts, labels, and colors. Further, it is also useful in cases where we want to display the results of your simulations on multiple windows because it will help us differentiate between the different sets of data among the figures.
How to Create a Figure Window in MATLAB Using the figure() Function?
We can easily and effectively generate a figure window in MATLAB using the figure() function which enables us to create an object figure having specifications of your choice. This function accepts some optional inputs and creates a figure window in MATLAB.
Syntax
In MATLAB, you can use the figure() function in the following patterns:
figure(Name,Value)
f = figure(___)
Here,
The function figure creates a figure window having default values and properties in MATLAB.
The function figure(Name,Value) creates a figure window having specified name and value pairs to specify figure properties.
The function f = figure(___) creates a figure object f that can be used to modify the figure window’s properties.
Example 1: How to Create a Figure Window Having Default Properties?
This MATLAB code generates a figure window having default properties using the figure function.

Note: For creating multiple figures, you have to write figures multiple times, each time with a different number for the figure window. For example, the following code creates two-figure windows:
figure(2)
Example 2: How to Create a Figure Window Having Specified Properties?
The given example creates a figure window by specifying its properties using the bar(Name, Value ) function in MATLAB.

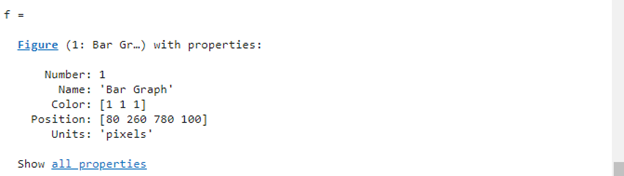
Example 3: How to Create a Figure Object in MATLAB?
In this MATLAB code, we use the f = figure() function to generate a figure object.


Example 4: How to Create a Figure Window in MATLAB with Specified Color or Background?
The given example uses the figure(“Color”,”black”) function to generate a figure window having a black background.

Example 5: How to Create a Figure Window in MATLAB with Specified Position?
This MATLAB code uses the f = figure() function to generate a figure object and use the dot operator to change the figure window position.
f.Position(1:4)=[80,260,780,100]

Conclusion
The figure() function in MATLAB is a powerful tool for creating and managing figure windows. It enables us to customize the appearance of our figures, such as changing their fonts, labels, and colors. It also allows us to create multiple figure windows, which can be useful for displaying the results of different simulations or data sets. This guide has presented the working of the figure() function in detail, including its syntax, examples, and benefits.