Follow this blog to learn how to use bode plots in MATLAB.
What are Bode Plots?
The Bode plots graph the phase and amplitude of both LTI systems against the frequency. These plots use the logarithmic scale for amplitude and frequency, measured in decibels(dB). The control system engineers can use these plots to efficiently see the phase margin and the gain margin of the control systems.
How to Use Bode Plot in MATLAB?
MATLAB supports Bode plots by using the built-in bode() function. This function uses the transfer function which can be created in MATLAB using the built-in tf() function.
To create a Bode plot, first, we need to create a transfer function using the tf() function. The reason is that the Bode plot shows the frequency response of the system, which can only be determined easily using the tf() function.
To use the tf() function, we will need the transfer function’s numerator and denominator. After that, we can use the transfer function to create a Bode plot using the bode() function in MATLAB.
Syntax
There are different syntaxes for the bode() function in MATLAB, which are given below:
bode(sys1,sys2,...,sysN)
bode(sys1,LineSpec1,...,sysN,LineSpecN)
Here:
The function bode(sys) generates a Bode plot for the dynamic system model “sys” using its frequency response. The plot displays the phase (in degree) and magnitude (in dB) as the function of the frequency of the system response.
The function bode(sys1,sys2,…,sysN) plots the multiple dynamic systems frequency response on the single figure window. All systems must have an equal number of inputs and outputs.
The function bode(sys1,LineSpec1,…,sysN,LineSpecN) specifies the line specifiers for each system’s plot.
Examples
Consider some examples to understand how to use Bode plots in MATLAB.
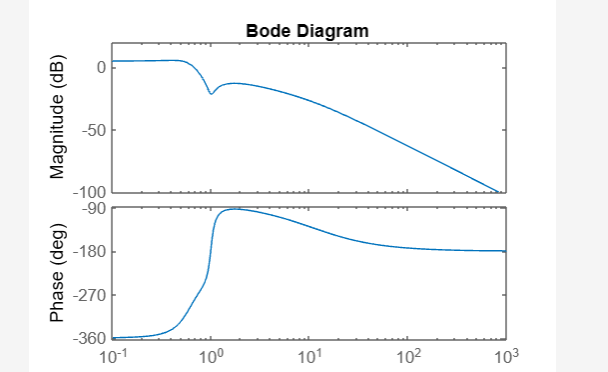
Example 1: How to Create Bode Plot for the SISO System in MATLAB?
The given example creates a Bode plot for the given single input single output dynamic system using the bode() function in MATLAB.
bode(H)
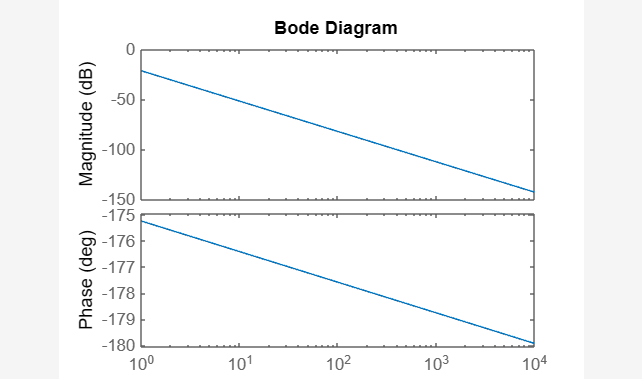
Example 2: How to Create Bode Plot for the SISO System by Specifying Frequencies in MATLAB?
In this example, we create a Bode plot for the given single input single output dynamic system by specifying the frequencies using the bode() function in MATLAB.
bode(H, [1,10000])
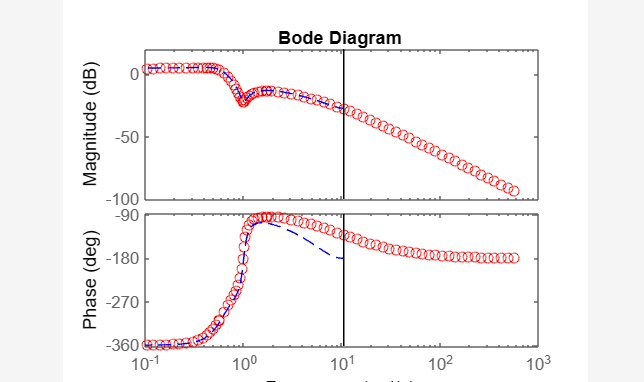
Example 3: How to Create Bode Plot for the Multiple Systems With Specified Line Attributes in MATLAB?
In this MATLAB code, we create a Bode plot for multiple dynamic systems by specifying the line attributes for each plot using the bode() function in MATLAB.
Hd = c2d(H,0.3,'zoh');
bode(H,'ro',Hd,'b--')
Conclusion
The Bode plots graph the phase and amplitude of both LTI systems against the frequency. The control system engineers can use these plots to efficiently see the phase margin and the gain margin of the control systems. MATLAB allows us to create the Bode plots using MATLAB’s built-in bode() function. We have to create a transform function using MATLAB’s built-in tf() function and then use the bode() function to create a Bode plot. This guide has provided the basics of Bode plots and helps us create them in MATLAB using the built-in bode() function.