MATLAB is a high-performance computing tool that has a wide library of built-in functions to perform various tasks including data visualization. It provides many built-in functions to plot different continuous and discrete data points. One among them is a bar graph used for plotting discontinuous and discrete data in the vertical and horizontal directions. A bar graph plotted along the y-axis is called a vertical bar graph while a bar graph plotted along the x-axis is called a horizontal bar graph.
This blog will present how to create a bar graph in MATLAB.
Why Do We Need a Bar Graph?
We need a bar graph to compare the value of different variables and show the trend over time. It also helps us to visualize the data distribution. The bar graphs are easy to create and are useful in communicating data effectively to a wide audience.
How to Create a Bar Graph in MATLAB using the bar() Function?
Plotting a bar graph in MATLAB is a simple task and can be done using the built-in bar() function. This function accepts one or two vectors as mandatory inputs and creates a bar graph corresponding to those vectors. It also accepts some optional inputs like bar style, width, color, and more.
Syntax
In MATLAB, you can use the bar() function in the following ways:
bar(x,y)
bar(___,bar_properties)
Here,
The function bar(y) generates a bar graph having a bar for each y element.
- If y represents a vector having length m, this function will create a series of bars from 1 to m along the x-axis.
- If y represents a matrix, the function will create multiple bars for each column of y.
The function bar(x,y) creates a bar graph on the specified location x.
The function bar(___,bar_properties) creates a bar graph using any above syntax specifying bar colors, bar width, and more.
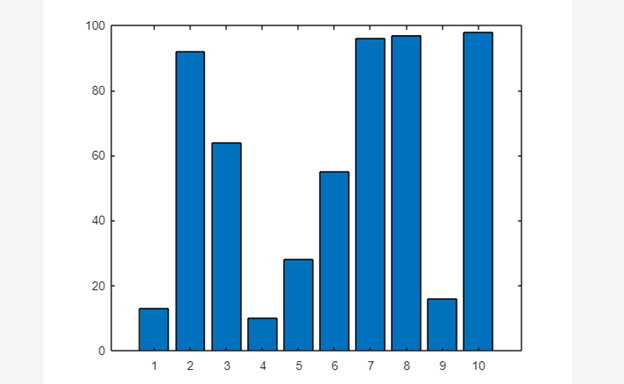
Example 1: How to Create Bar Graph Using bar(y) Function?
This MATLAB code generates a bar graph using MATLAB’s bar(y) function.
<strong>bar(y)
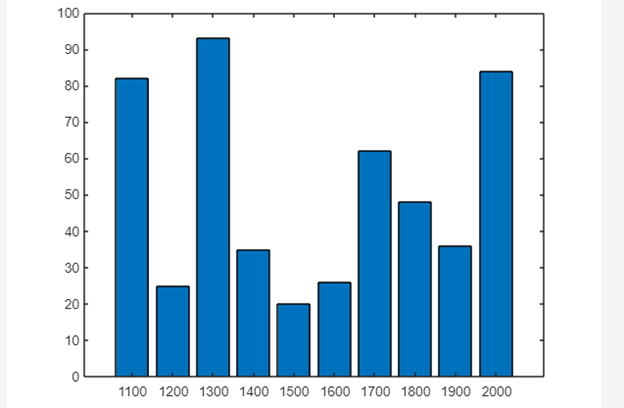
Example 2: How to Create a Bar Graph by Specifying Location?
The given example creates a bar graph by specifying the location on the x-axis using the bar(x,y) function in MATLAB.
y = randi(100,1,10);
bar(x,y)
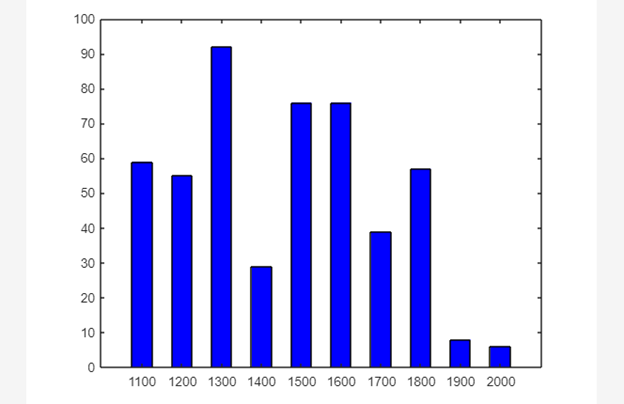
Example 3: How to Create a Bar Graph by Specifying Bar Properties?
In this MATLAB code, we use the bar(x,y,bar_properties) function to generate a bar graph by specifying bar width and color.
y = randi(100,1,10);
bar(x,y, 0.5,'blue')
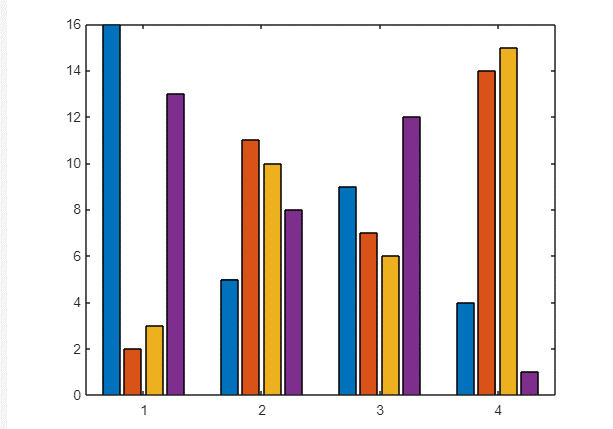
Example 4: How to Create a Bar Graph Corresponding to a Matrix?
In this example, we use the bar(y) function to generate a bar graph corresponding to a matrix y.
bar(y)
Conclusion
bar() is a useful function that helps us create bar graphs in MATLAB. We can use bar graphs to compare different results which are useful for communicating data to a wide audience. This guide has demonstrated the working of bar() function in MATLAB by providing its syntaxes and some basic examples to help us understand the workings of this function.