Method 1: Using the figure Command
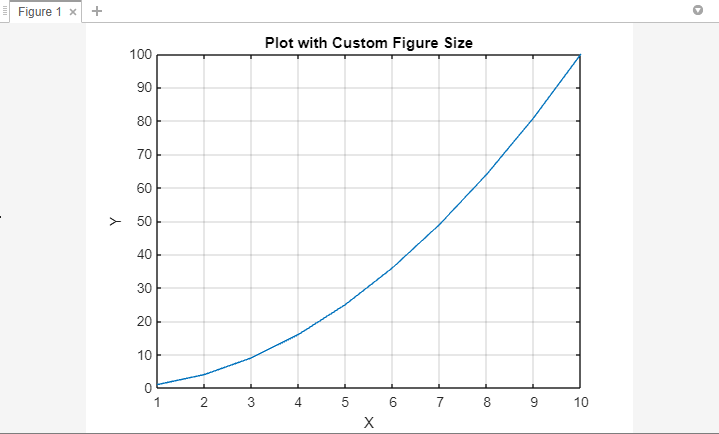
The figure command in MATLAB allows you to create a figure with custom dimensions. Altering the size of a figure can be accomplished by specifying the width and height parameters. By providing specific values for these parameters, you can customize the dimensions of the figure to suit your requirements:
Adjust the values of x, y, width, and height to set the desired position and dimensions of the figure. Below is the complete code that demonstrates the alteration of figure size using the figure command:
x = 100; % x-coordinate of the figure's bottom-left corner
y = 100; % y-coordinate of the figure's bottom-left corner
width = 800; % width in pixels
height = 600; % height in pixels
% Create a figure with custom dimensions
figure('Position', [x, y, width, height]);
% Plot your data or add visual elements
% Example: Plot a simple line
xData = 1:10;
yData = xData.^2;
plot(xData, yData);
% Customize the plot (add labels, title, etc.)
xlabel('X');
ylabel('Y');
title('Plot with Custom Figure Size');
% Display the grid
grid on;
% Show the figure
In the code above, adjust the values of x, y, width, and height according to your desired position and dimensions for the figure. You can plot your data or add any other visual elements using the appropriate MATLAB functions.
Method 2: Modifying the PaperPosition Property
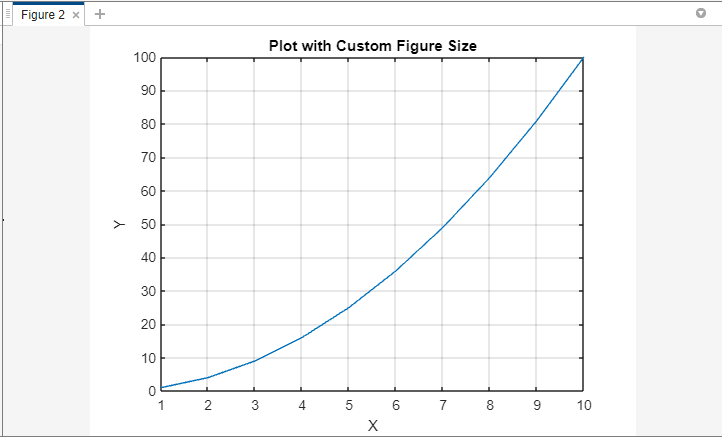
The PaperPosition property of the figure determines its size when printed or saved. By adjusting this property, you can indirectly change the figure size:
Set the values of left, bottom, width, and height to specify the position and dimensions of the figure. Below is the complete code that demonstrates the alteration of figure size using the PaperPosition property:
left = 0; % Left position of figure on printed page
bottom = 0; % Bottom position of figure on printed page
width = 8.5; % Width in inches
height = 6; % Height in inches
% Create a figure
figure;
% Modify the 'PaperPosition' property
set(gcf, 'PaperPosition', [left, bottom, width, height]);
% Plot your data or add visual elements
% Example: Plot a simple line
xData = 1:10;
yData = xData.^2;
plot(xData, yData);
% Customize the plot (add labels, title, etc.)
xlabel('X');
ylabel('Y');
title('Plot with Custom Figure Size');
% Display the grid
grid on;
In the code above, adjust the values of left, bottom, width, and height according to your desired position and dimensions for the figure. You can plot your data or add any other visual elements using the appropriate MATLAB functions.
Method 3: Adjusting the OuterPosition Property
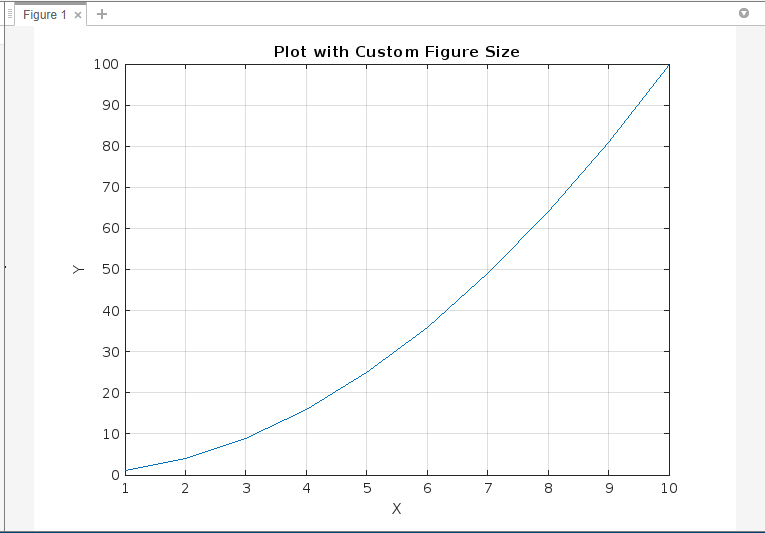
The OuterPosition property represents the position and size of the figure, including the window frame.
Specify the values of left, bottom, width, and height to set the position and dimensions of the figure, including the window frame. Below is the complete code that demonstrates the alteration of figure size using the OuterPosition property:
left = 100; % Left position of the figure window
bottom = 100; % Bottom position of the figure window
width = 800; % Width of the figure window in pixels
height = 600; % Height of the figure window in pixels
% Create a figure
figure;
% Modify the OuterPosition property
set(gcf, 'OuterPosition', [left, bottom, width, height]);
% Plot your data or add visual elements
% Example: Plot a simple line
xData = 1:10;
yData = xData.^2;
plot(xData, yData);
% Customize the plot (add labels, title, etc.)
xlabel('X');
ylabel('Y');
title('Plot with Custom Figure Size');
% Display the grid
grid on;
In the code above, adjust the values of left, bottom, width, and height according to your desired position and dimensions for the figure. You can plot your data or add any other visual elements using the appropriate MATLAB functions.
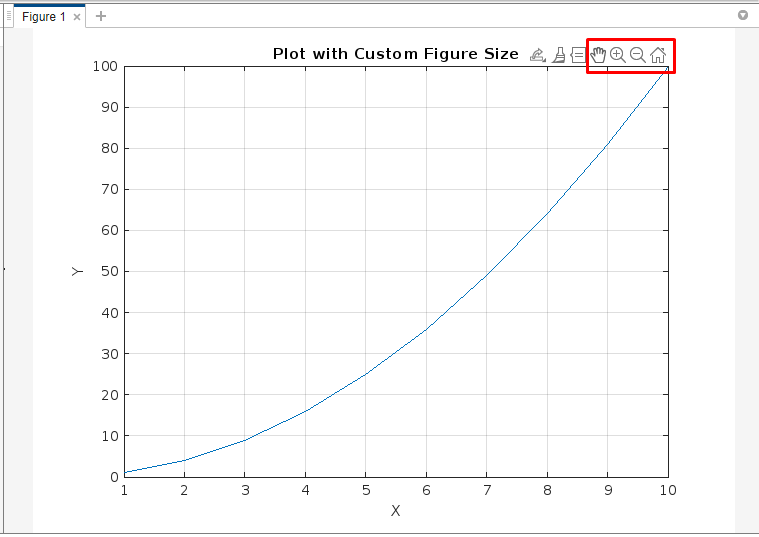
Method 4: Manually Resizing the Figure
MATLAB also provides a manual resizing option for figures. Simply click and drag the edges or corners of the figure window to adjust its size interactively. This method is useful when you want to visually fine-tune the figure dimensions.
Conclusion
Changing the figure size in MATLAB is crucial for creating visually appealing plots. By utilizing methods such as the figure command, modifying properties like PaperPosition and OuterPosition, and manually resizing the figure, you can effectively customize the dimensions of your plots.