What is the MATLAB Colormap?
Different colors are used to create the plots. The color variation enhances the plots’ three-dimensional visualization. The colormap(C) command can be utilized for changing the color. In this command, C represents a three-element vector whose first, second, and third elements, respectively, determine the intensity of the RGB colors (Red, Green, and Blue). Each element of the vector C can be a number ranging from 0 (lowest intensity) to 1 (highest intensity). Some of these colors are listed below:
- C = [1 0 0] represents red
- C = [1 1 0] represents yellow
- C = [1 0 1] represents magenta
- C = [0 0 1] represents blue
- C = [0 0 0] represents black
- C = [0.5 0.5 0.5] represents gray
- C = [0 1 0] represents green
Now consider some examples which demonstrate the usage of colormap in MATLAB.
Example 1
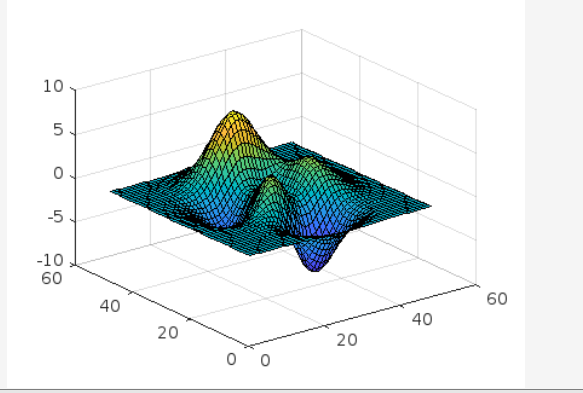
In the given example, a default colormap is used in the plot visualization.
colormap default
Example 2
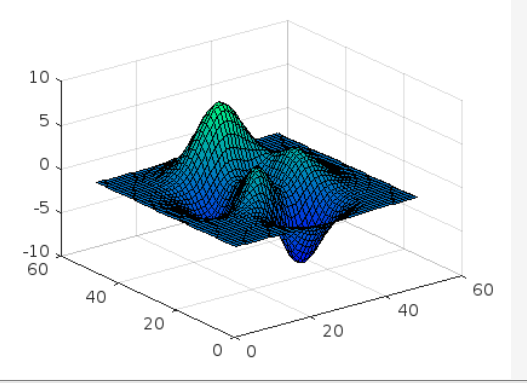
This MATLAB code generates a surface plot and defines the colormap winter.
colormap winter
Example 3
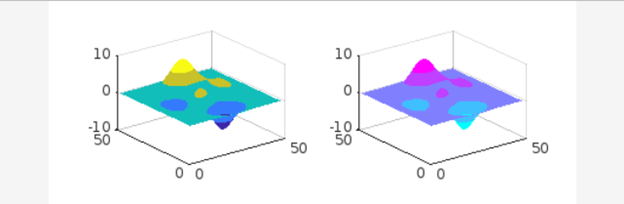
In this example, we are working with two axes, so we assign a different colormap to each axis as shown below.
ax1 = nexttile;
surf(peaks);
shading interp;
colormap(ax1,parula(5));
ax2 = nexttile;
surf(peaks);
shading interp;
colormap(ax2,cool(5));
Example 4
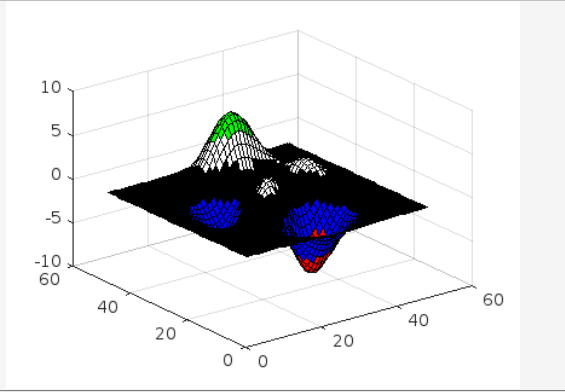
In this example first, we define a matrix in which each row defines a different color using the RGB triplet. These colors are red, blue, black, white, and green respectively. After that, we make a surface and use the colormap function to change the visualization’s color scheme.
surf(peaks)
colormap(cmap)
Conclusion
Surface plots and other visualizations are displayed by MATLAB using a default color scheme. The colormap can be used to modify this color scheme. In most cases, colormaps are three-column RGB triplet arrays where each row denotes a different color. This tutorial implemented the colormap function using multiple ways as illustrated in the examples.