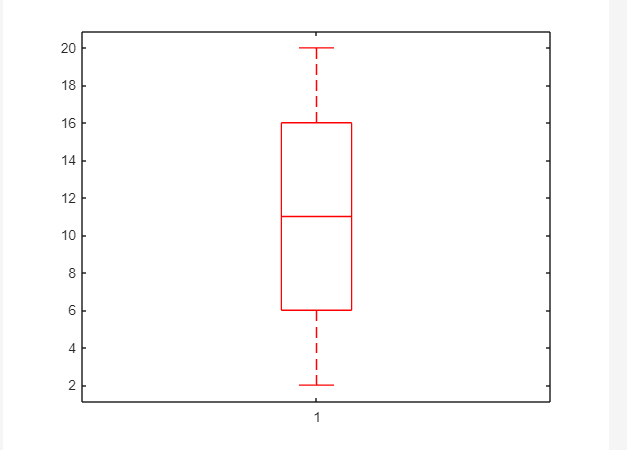
The box plot is a descriptive statistical technique used for summarizing a data set measured by an interval scale. Another name for this plot is the whisker plot which is widely used to perform data analysis like determining data distribution shape, its variability, and central value. MATLAB provides us with a built-in boxplot() function to visualize summary statistics.
This blog is going to present the working of the boxplot() function with different syntaxes in MATLAB.
How to Visualize Summary Statistics in MATLAB Using the boxplot() Function?
In MATLAB, the graphical visualization of the summary statistics of a data set can be performed using the built-in boxplot() function. This function takes the data set as a mandatory argument and draws its box plot on the figure window in MATLAB.
Syntax
In MATLAB, the boxplot() function uses different syntaxes as given below:
boxplot(x,g)
boxplot(___,Name,Value)
Here,
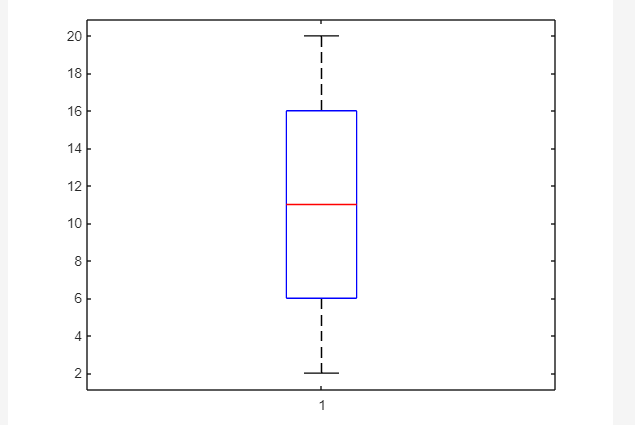
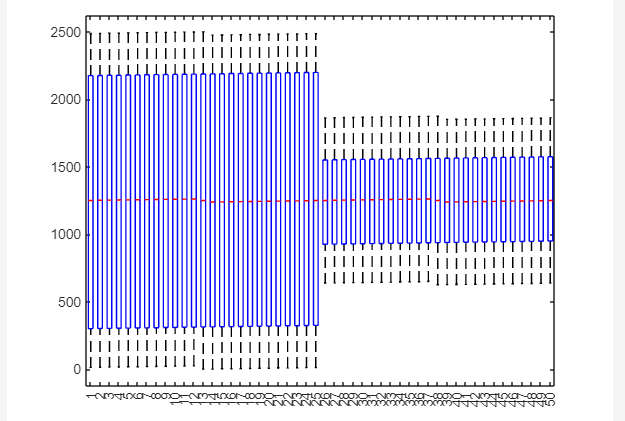
The function boxplot(x) yields to plot a box plot for data in x. On every box, the top and bottom edges show the 75th and 25th percentiles respectively, and the central mark identifies the median of x.
- If x represents a vector, the function will plot a single box.
- If x represents a matrix, the function will plot multiple boxes for each column of x.
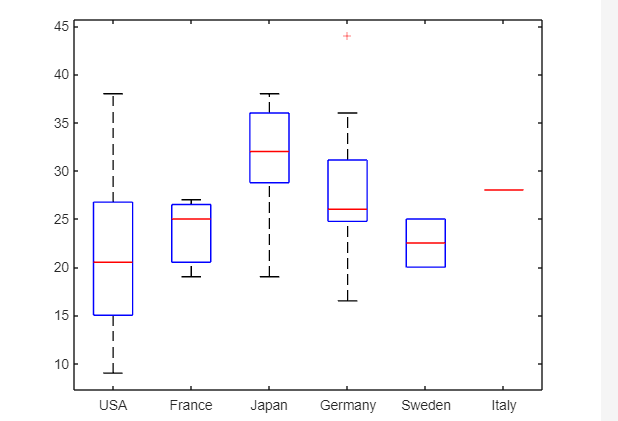
The function boxplot(x,g) creates a box plot using one or more grouping variables held by g. This function creates a separate box for each set of values in x that share the same values as g.
The function boxplot(___,Name,Value) creates a box plot using the specified optional Name, value pairs arguments.
Example
Consider some examples to understand the implementation of the boxplot() function in MATLAB.
Example 1: How to Create a Box Plot for a Vector in MATLAB?
In this MATLAB code, we use the boxplot() function to create a box plot for a vector in MATLAB.
boxplot(x)
Example 2: How to Create a Box Plot for a Matrix in MATLAB?
The given example creates a box plot for a matrix in MATLAB using the boxplot() function.
boxplot(x)
Example 3: How to Create a Box Plot for Grouped Data in MATLAB?
In the given example, first, we create a box plot for the given grouped data using the boxplot() function in MATLAB.
boxplot(MPG,Origin)
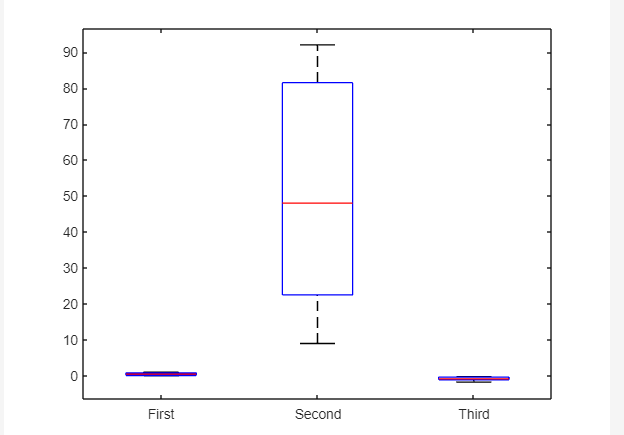
Example 4: How to Create a Box Plot for Different Vectors Having Different Lengths in MATLAB?
In the MATLAB code, we use the boxplot() function to create a boxplot for different vectors having different lengths.
y = randi(100,20,1);
z = randn(7,1);
X = [x; y; z];
g1 = repmat({'First'},10,1);
g2 = repmat({'Second'},20,1);
g3 = repmat({'Third'},7,1);
g = [g1; g2; g3];
boxplot(X,g)
Example 5: How to Create a Box Plot by Specifying Optional Properties in MATLAB?
In this example, we use the boxplot() function to create a box plot for a vector having a red color in MATLAB.
boxplot(x,"Colors","r")
Conclusion
The box plot is a descriptive statistical method used for summarizing data sets measured by an interval scale. The plot is easy to use and can be created through the built-in boxplot() function in MATLAB. Through the boxplot() function, you can customize the box plot according to your needs. This guide has presented how to implement the boxplot() function in MATLAB since it provides the basics of this function including its syntaxes and examples to help us understand it’s working.

