This guide will show you how to add descriptive text to the data points using the text() function in MATLAB. We will cover different syntaxes and examples so that you can learn how to use it in different ways
How to Descriptive Text to Data Points on a Plot in MATLAB?
To add descriptive text to the data points on a plot in MATLAB, we can use the built-in text() function. This function takes one or more data points and the descriptive text as mandatory inputs and provides the description corresponding to the given data points. You have to specify the coordinates of the data points since they represent the location where the text needs to be added in the MATLAB plot.
Syntax
In MATLAB, you can use the text() function in the following ways:
text(x,y,z,txt)
text(___,Name,Value)
Here,
The function text(x,y,txt) is responsible for adding the text descriptions to one or more data points using the text specified by the variable txt in the current axes.
- To specify a description of one data point, this function takes x and y as scalar values.
- To specify a text description of more than one data point, this function takes x and y as vectors having the same size.
The function text(x,y,z,txt) is responsible for positioning the text in 3D coordinates.
The function text(___,Name,Value) is responsible for specifying the text object properties utilizing one or more Name, Value pair arguments.
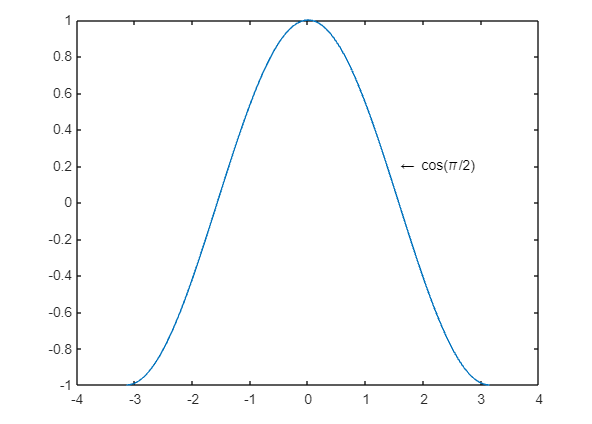
Example 1: How to Add Descriptive Text to One Data Point in MATLAB?
This MATLAB code uses the text() function to specify the description of the point (pi/2,0.2).
y = cos(x);
plot(x,y)
text(pi/2,0.2,'\leftarrow cos(\pi/2)')
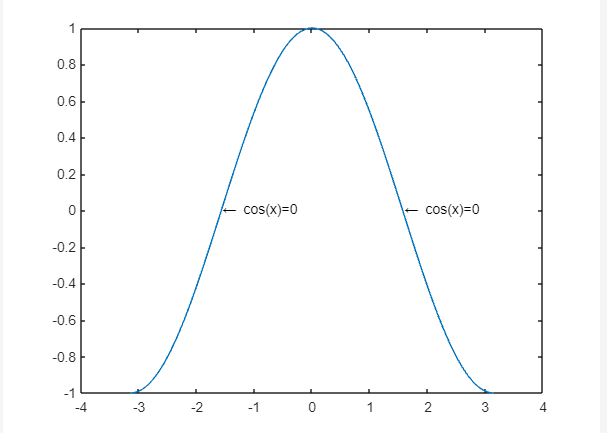
Example 2: How to Add Descriptive Text to Multiple Data Points?
The following code used the plot function to plot cos(x) function over the range [-π, π]. The text() function is used to add two text annotations to the plot, indicating where the function crosses the x-axis.
y = cos(x);
plot(x,y)
x_vect= [-pi/2,pi/2];
y_vect= [0,0];
text(x_vect,y_vect,'\leftarrow cos(x)=0')
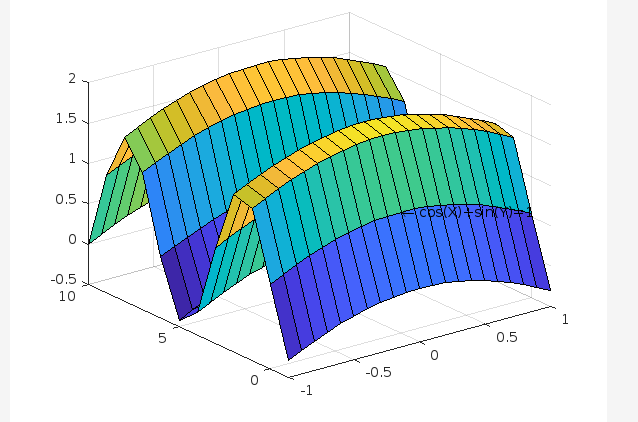
Example 3: How to Add Descriptive Text to 3D Data Points?
In this MATLAB code, we generate a surface plot for the function Z=cos(X)+sin(Y) corresponding to the given vectors x and y. After that, we locate a point (0,0,1) and add its description which is cos(X)+sin(Y)=1.
Z = cos(X)+sin(Y);
surf(X,Y,Z)
text(0,0,1,'\leftarrow cos(X)+sin(Y)=1')
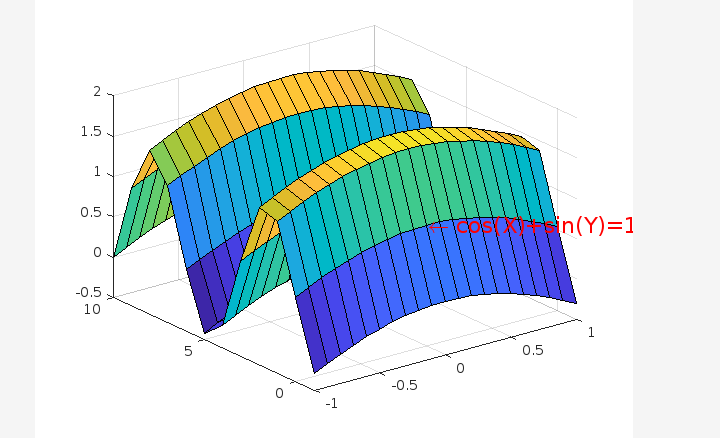
Example 4: How to Specify Text Size and Color While Adding Descriptive Text to a Data Point?
The below-given example generates a surface plot for the function Z=cos(X)+sin(Y) corresponding to the given vectors x and y. After that, it locates a point (0,0,1) and adds its description which is cos(X)+sin(Y)=1 by specifying the text collar as blue and text size = 16.
Z = cos(X)+sin(Y);
surf(X,Y,Z)
text(0,0,1,'\leftarrow cos(X)+sin(Y)=1','Color','red','FontSize',16)
Conclusion
In the domain of data visualization, we need to describe the plotted data points to make our plots clear and understandable. This task can be efficiently performed using the text() function in MATLAB. This tutorial has described the functionality of the text() function in MATLAB. We have provided different syntaxes for the text() function and an easy example for each syntax to help you understand the workings behind the function.