In this guide, check out how to check CPU utilization in Linux.
CPU utilization in Linux
The CPU is the primary source of all the processing power a computer offers. To get the most out of it, it’s necessary to manage and optimize its usage.
Modern operating systems are optimized to use the CPU as efficiently as possible. Even other apps out there are quite optimized. However, users may not be. In my case, for example, I play games while there are hundreds of browser tabs open and multiple background tasks running. While all the software is optimized, my way of usage will cause a higher CPU load.
If multiple users are logged in, then the CPU usage will automatically be high. However, the system admin may want to keep an eye on it to ensure that someone isn’t hogging all of it, causing overall poor system performance and experience. If a certain process/app is causing too much CPU usage, it may either be malfunctioning, bugged or that’s the nature of it.
Sometimes, unusual CPU usage may also indicate that there’s a system intrusion.
Based on all this information, checking CPU utilization can be quite insightful.
Check CPU utilization in Linux
In the case of Linux, there are numerous tools to monitor CPU usage. It has various built-in system calls to extract performance readings. Some of the tools come pre-installed with all Linux distros, some may require manual installation.
All the following methods are demonstrated on Ubuntu 20.04.1 LTS. However, they’ll work just fine on any other modern distro.
Check CPU utilization using top
Using top, you can monitor the system in real-time. It reports a brief summary of system information along with a list of processes and threads currently being managed by the Linux kernel. It also offers interactive options to modify its behavior and perform various actions.
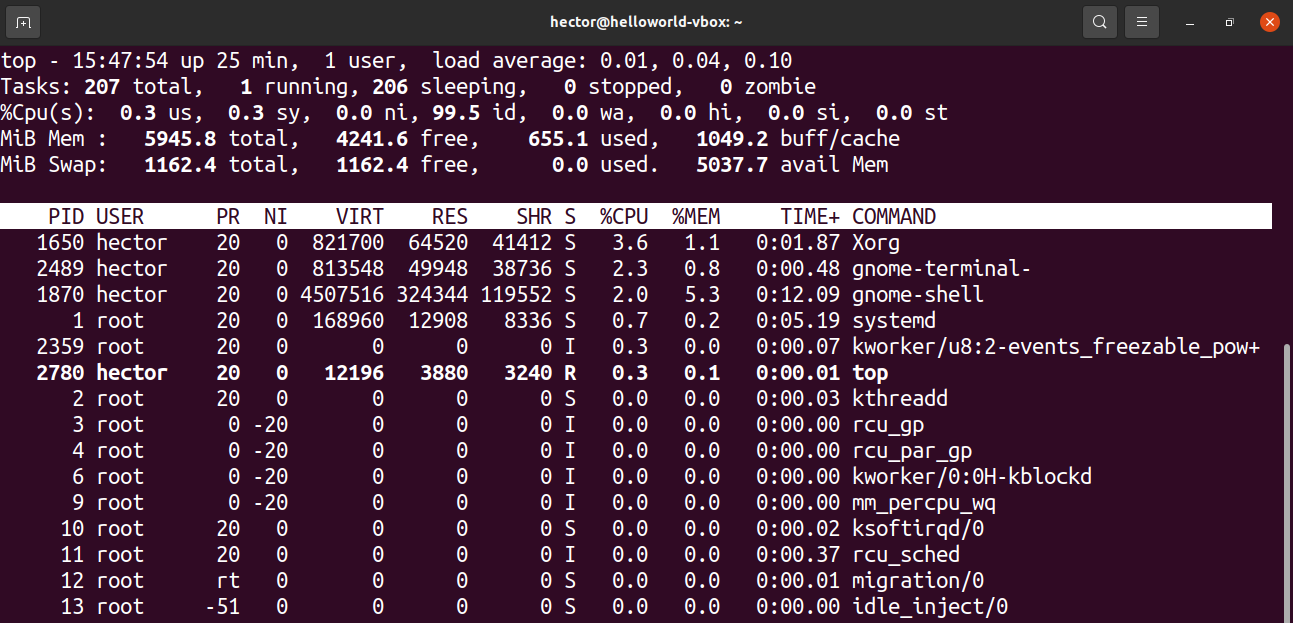
The top tool can show CPU utilization. Launch the tool.
Here, the key line to focus on is the third one. The output values are explained briefly. Each value explains the amount of time the CPU spends performing something.
- us: Time spent running processes for people in the “user space”.
- sy: Time spent running “kernel space” processes.
- ni: Time spent running processes with custom (manually set) nice value.
- id: Time spent idle.
- wa: Time spent waiting for I/O request completion.
- hi: Time spent servicing hardware interrupts.
- si: Time spent servicing software interrupts.
- st: Time lost for running virtual machine, also known as “steal time”.
Now, you can sort and filter the process list with various hotkeys. Here, I’ve described the ones that are associated with CPU usage.
- P: Sort processes by CPU usage.
- I: Remove idle processes from the list. To revert, press “I” again.
- M: Sort the list by memory usage.
- S: Sort the list by how long processes have been running.
- U: Filter the processes by the owner.
- K: Kill a process. Requires the PID of the process.
Check CPU utilization using htop
Htop and top both are essentially the same tools. They both offer the same features in terms of system monitoring capability. However, htop offers a better quality-of-life experience.
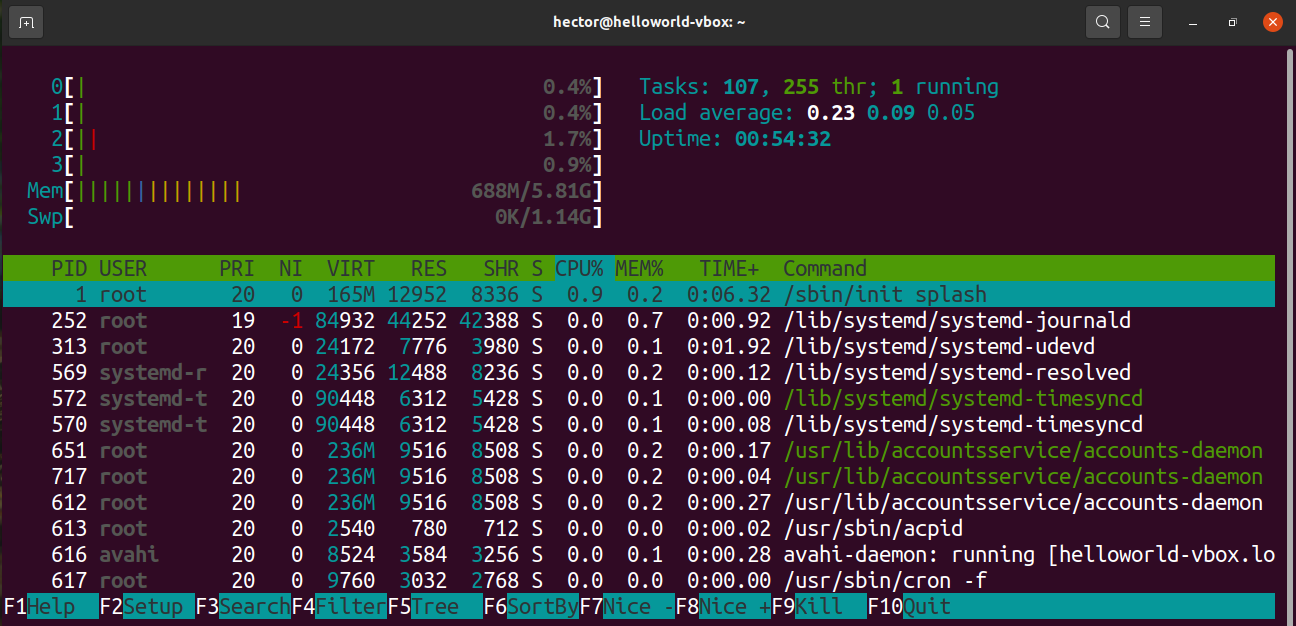
The default display of the htop is more comfortable to work with. The UI has better clarity than the top. The texts are colorized and pleasant to look at. It also offers both horizontal and vertical scrolling.
While most distros will have top installed by default, you have to install htop manually. It’s best to install htop using snap as it works on any Linux distro. Assuming you have snappy (the snap package manager) installed, run the following command.
Launch htop.
I’ll not discuss anything further as the usage of htop is the same as the top.
Check CPU utilization using iostat
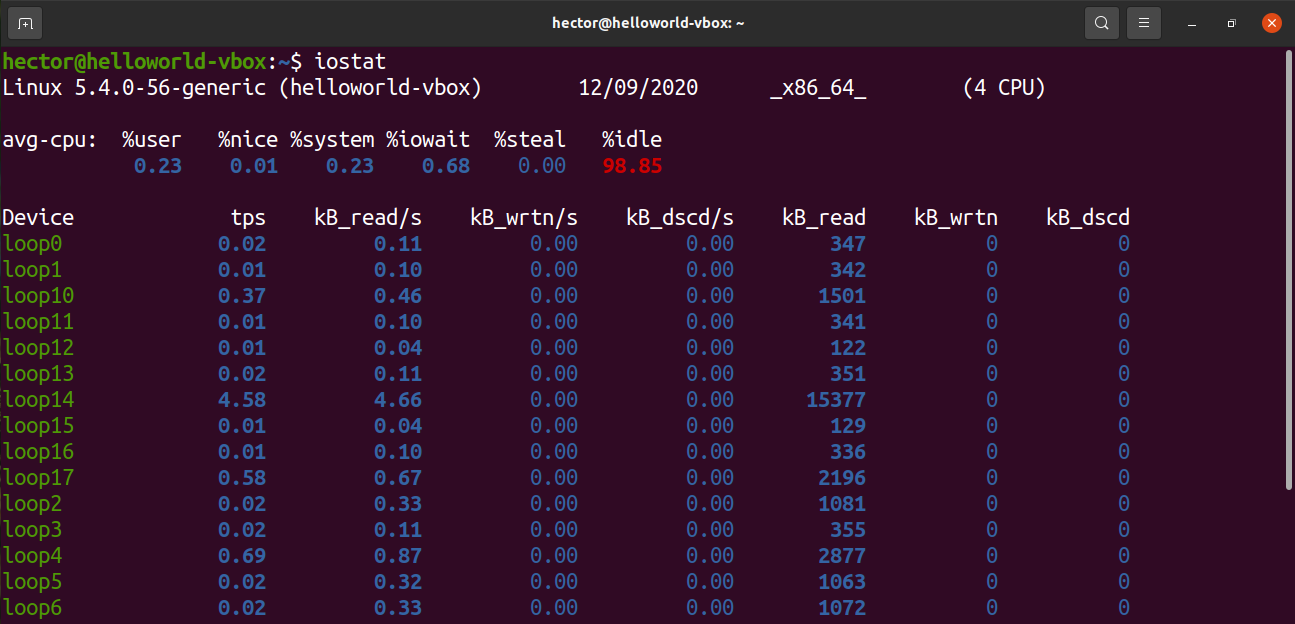
The iostat tool reports CPU and I/O usage statistics. It’s a simple tool with simple output. However, it will only report the statistics of the moment the tool was run. Unlike top or htop, iostat doesn’t offer real-time system monitoring.
The iostat tool comes as a part of the sysstat package. It’s available on almost any Linux distro. Assuming you’ve installed the sysstat package, let’s move on.
Launch iostat.
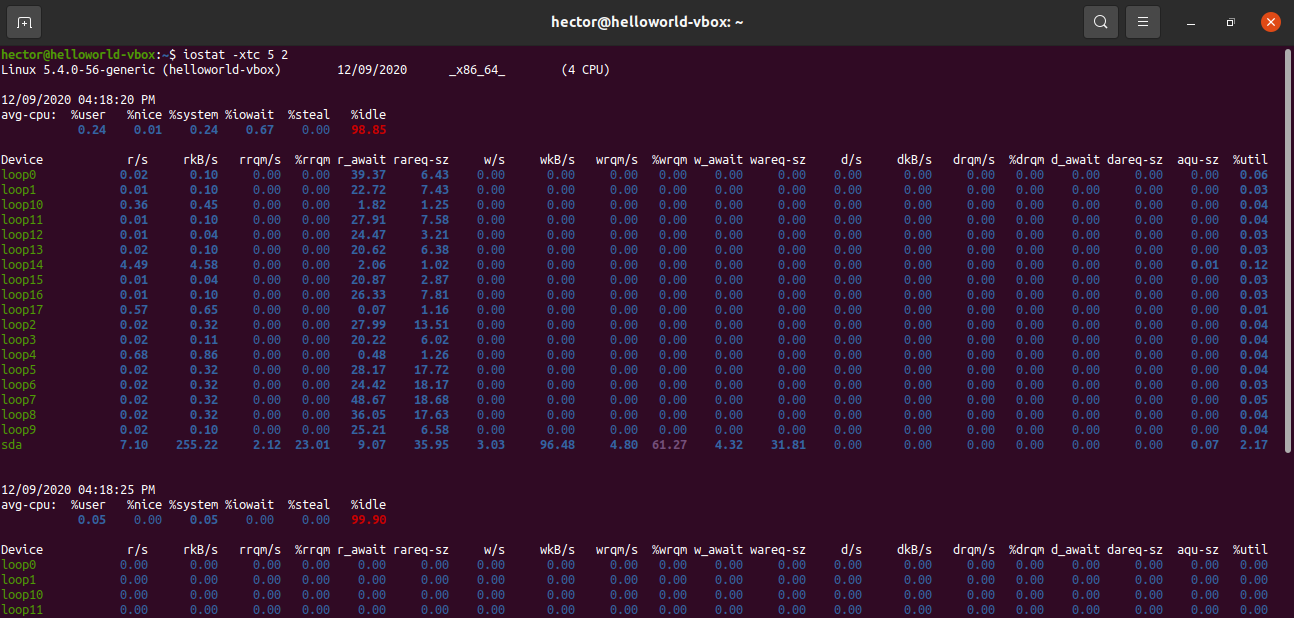
Interested in a more in-depth report? Use the “-c” flag to see CPU usage of user processes, system processes, I/O wait, and idle time.
Use the flag “-x” for extended statistics. The flag “-t” will define how many times each report should be displayed.
Check CPU utilization using mpstat
The mpstat tool is a part of the sysstat package. The tool reports the usage of individual processors or processor cores.
To use mpstat, you have to have the sysstat package installed in your system. Assuming you already have the package installed, let’s move ahead.
Launch mpstat.
Here’s what the values mean. Each value describes the CPU usage at a certain level.
- %usr: User-level CPU usage.
- %nice: CPU usage by “nice” user processes.
- %sys: CPU usage by the kernel.
- %iowait: Waiting for disk read/write.
- %irq: Handling hardware interrupts.
- %soft: Handling software interrupts.
- %steal: Forced waiting for a hypervisor handling virtual processors.
- %guest: Running a virtual processor.
- %idle: Standing idle.
Check CPU utilization using sar
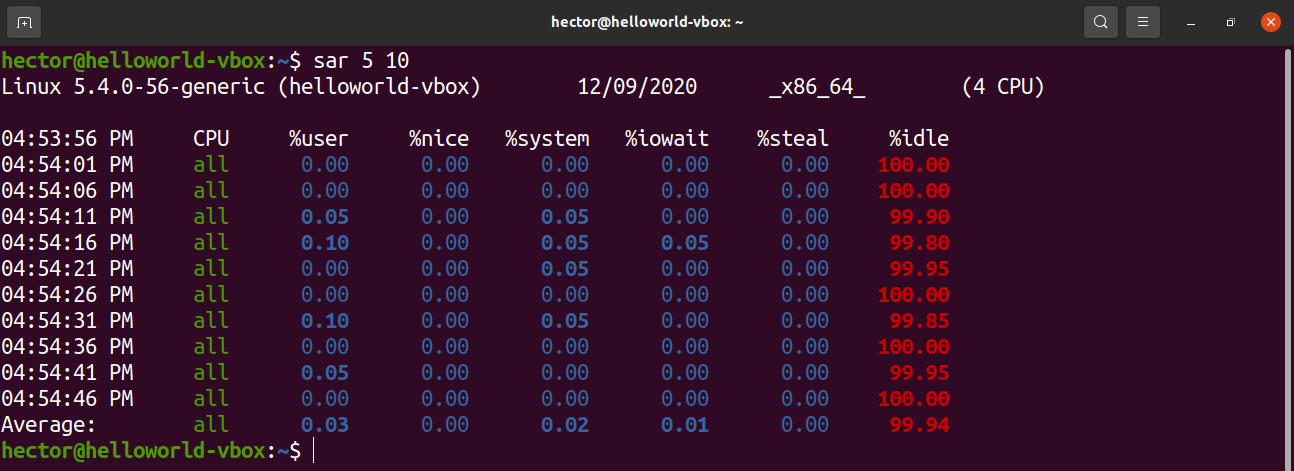
The sar command is for collecting and reporting system activity information. It offers a short and simple report about CPU utilization.
We can use sar to offer the CPU information at a certain interval (in seconds). While it’s not a real-time report, it’s still better to work with.
In the last example, sar would run infinitely. We can define how many instances sar will print the output. In the following example, sar will print the output at 5 seconds interval, for 10 times.
Check CPU utilization using vmstat
The vmstat tool reports various system information like system processes, memory, swap, CPU performance, and I/O.
Run vmstat. It’ll report the system information of the moment it was run.
Similar to sar, vmstat can report the system status at a fixed interval (in seconds).
In the last step, vmstat would run infinitely. To run vmstat for a fixed period of time, define the number of runs. Here, vmstat will report system status at 3 seconds interval, for 10 times.
Check CPU utilization using Glances
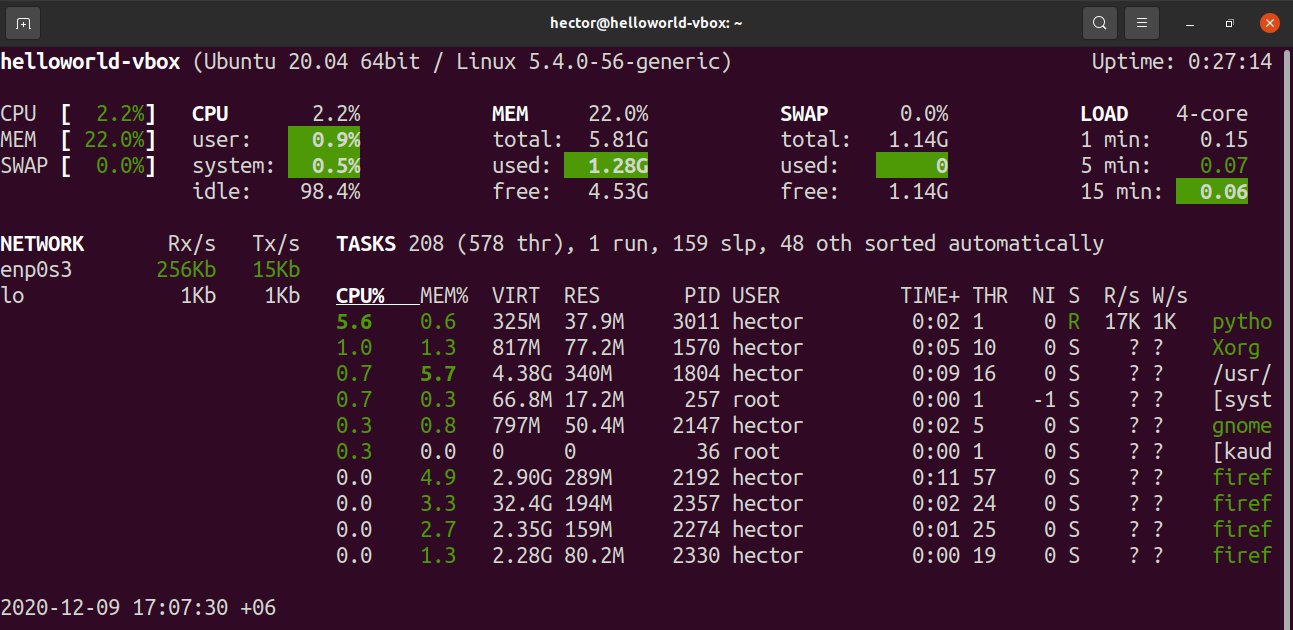
Glances is a powerful tool for monitoring system status. It’s written in Python that uses the psutil library for grabbing various system information. Glances offer lots of in-depth system info like CPU monitoring, memory, network usage, disk I/O, processes, and filesystem utilization, etc. Check out Glances at GitHub.
Installing Glances is a simple task. The following method will work on any GNU/Linux distro. All you need is to have either curl or wget installed in your system. Glances will be installed with all the necessary dependencies.
$ wget -O- https://bit.ly/glances | /bin/bash
Glances are also available as a snap package. Assuming you have snappy (snap package manager) installed in your system, install Glances snap from Snapcraft. Check out Glances at Snapcraft.
Using Glances is very simple. To start the standalone mode, run the following command.
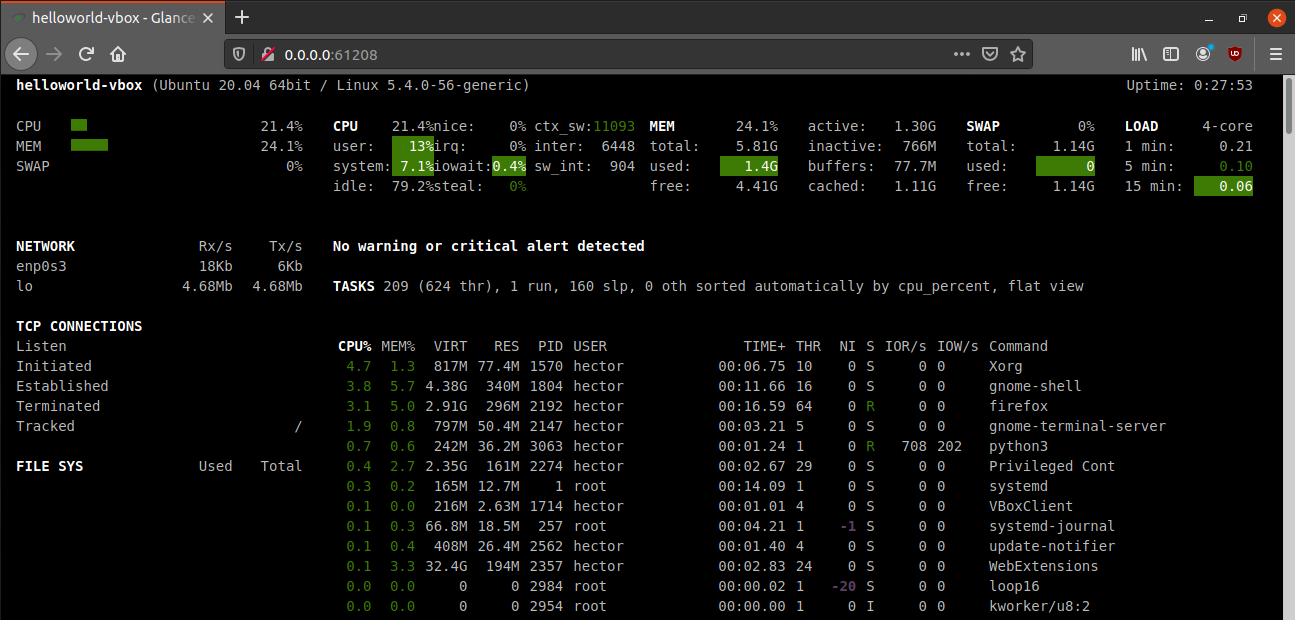
Glances also offer to run in web server mode. To start the webserver, run the following command.
To access the server, go to the following URL.
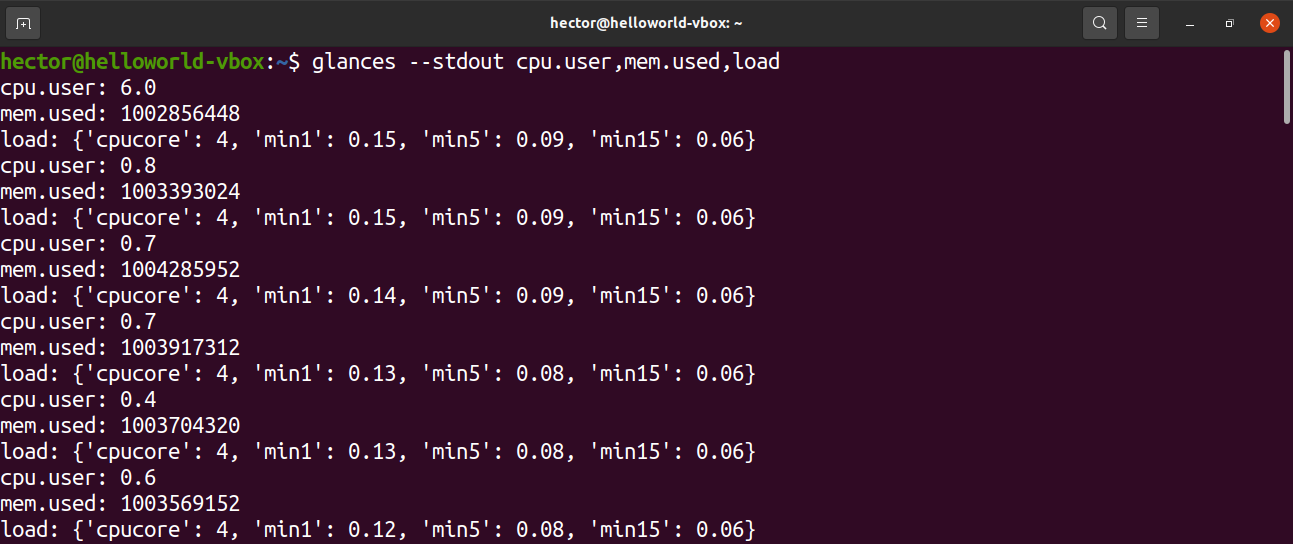
For raw information output, Glances can print the output to STDOUT.
Final thoughts
There are plenty of ways to get CPU utilization. While all of them work just fine, depending on your necessity, you may have to stick with a few of them. If you’re a system admin, then mastering top/htop and Glances offer the most flexibility. If you just want a quick update of the system resource consumption, then other methods offer a better experience.
Checking CPU utilization is fine and useful. However, to ensure stability, it’s necessary to verify that your system can function fine even under the maximum stress. Check out some useful Linux apps to stress test and benchmark CPU performance.
Happy computing!

