Creating an Array
At the start, we have to define the arrays so we can plot them later. You can create an array in MATLAB in several ways. We can define a custom array, or we can also generate random arrays with the help of the rand() function in MATLAB.
Once you have created an array, we can plot it with the help of the plot() function in MATLAB. This function contains two arguments: the x-coordinates and the y-coordinates of the points to plot.
Example of Plotting an Array in MATLAB
To begin, let’s assume we have an array of data points that we want to plot. We can start by creating the array in MATLAB with the help of the below code:
x = [1, 2, 3, 4, 5];
y = [4, 7, 2, 9, 6];
In this example, we have two arrays, x, and y, which represent the x and y coordinates of our data points, respectively.
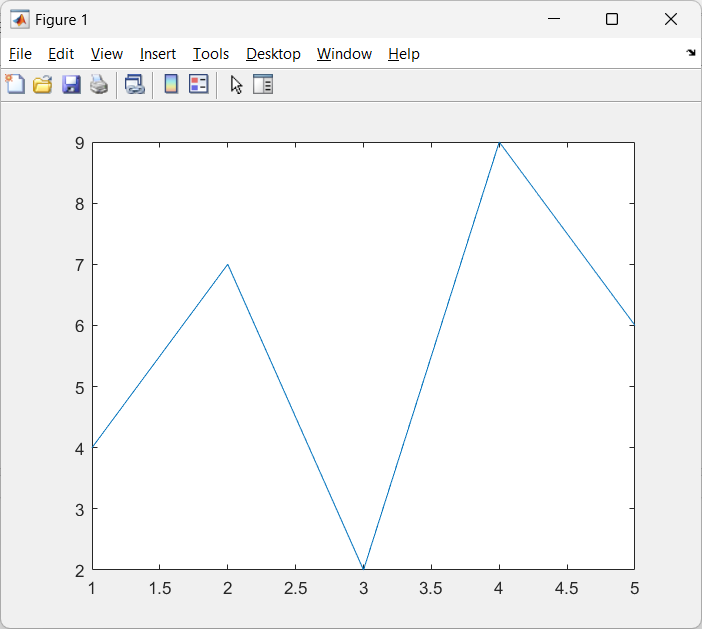
After defining the arrays of data points next, we can plot them using the plot function in MATLAB. Below MATLAB code plots the arrays x and y:
x = [1, 2, 3, 4, 5];
y = [4, 7, 2, 9, 6];
% Plotting the array
plot(x, y);
By executing this code, MATLAB will generate a plot of the data points as a line graph, connecting the coordinates in the order specified. The resulting plot will have the x-axis labeled with the values from the x array and the y-axis labeled with the values from the y array.
Customizing a Plot
If you want to customize the plot further, MATLAB provides numerous options. For instance, we have the option of adding the plot name or giving the title to the axis. We can also change the line style or can add a legend to the plot.
Below MATLAB code will customize the above plot.
x = [1, 2, 3, 4, 5];
y = [4, 7, 2, 9, 6];
% Customizing the plot
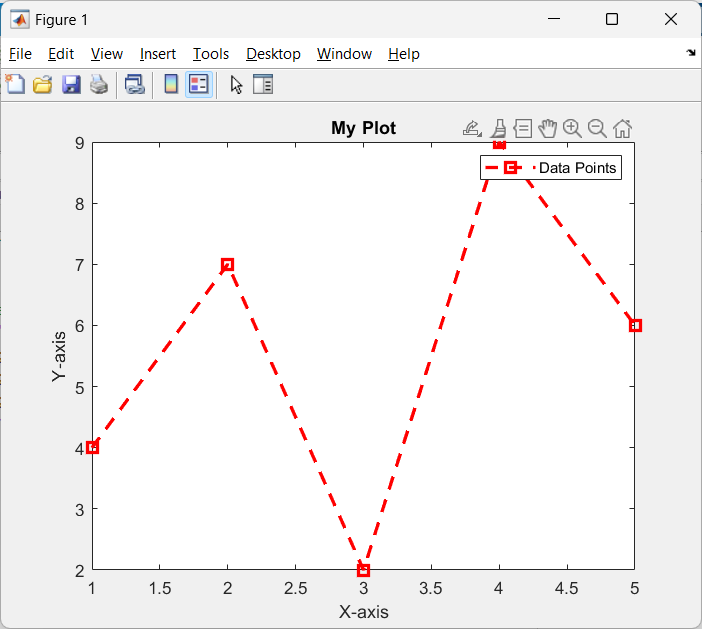
plot(x, y, '--rs', 'LineWidth', 2, 'MarkerSize', 8);
title('My Plot');
xlabel('X-axis');
ylabel('Y-axis');
legend('Data Points');
Here we use additional arguments to customize the plot. The rs argument specifies a dashed line with red squares as markers. The LineWidth and MarkerSize arguments control the thickness of the line and the size of the markers, respectively. The title, xlabel, ylabel, and legend functions are used to add a title, label the axes, and provide a legend to the plot.
Conclusion
In MATLAB we can define and plot arrays using the plot function. We can also customize the properties of plotted arrays by defining them as an argument of this function. Using the customized plot, we can visually present information on plots in a better way. Read the article to know about plotting arrays in MATLAB.