What Are Kubectl Logs?
In Kubernetes, kubectl logs are the most essential command that prints the logs that contain the pod’s daily tasks and returns this workflow to the terminal. Logs are a form of text archives that can be used to track any kind of resource and application behaviors. It is mostly used in computers to track and gather the data on the health and performance of applications.
The “kubectl logs” command in Kubernetes is used to access the data on the containers and pods in your cluster. The “kubectl logs” command is covered in this tutorial so that you may retrieve the logs of data for pods and containers. The “kubectl logs” command can be used to get the pod and container logs once the cluster is operating.
Now, let’s move on to the step-by-step process that you can follow to understand how you can use the “kubectl logs” command.
Step 1: Start the Minikube Tool
In this step, we run the command to start the new cluster of Kubernetes in our Linux operating system. In this example, we start a minikube cluster using the following command:
When you execute this command, it shows the output as follows:
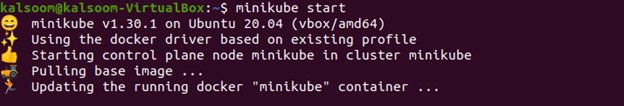
In this step, minikube is successfully running. Now, we move to the next kubectl commands.
Step 2: Get a List of Pods in Kubernetes
In this step, we will learn about the command to list down all the Pods details in the cluster. The following script is executed to check the list of pods:
We execute the command and the resultant screenshot is attached in the following:
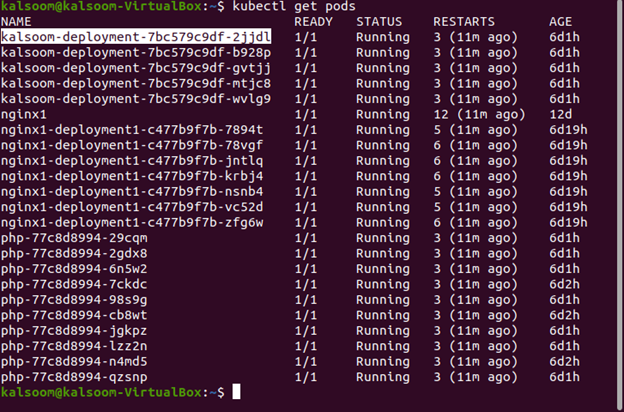
In the given output result, we select one pod name as “kalsoom-deployment-7bc579c9d-2jjdl”. We fetch the log file of this specific container. Let’s move on to the next step to check the details of the selected pod.
Step 3: Get the Selected Pod Details
In this step, we use the following command to retrieve the details of a specific pod. It describes the selected pod in the cluster. The following script is executed:
The provided command gives the following result:
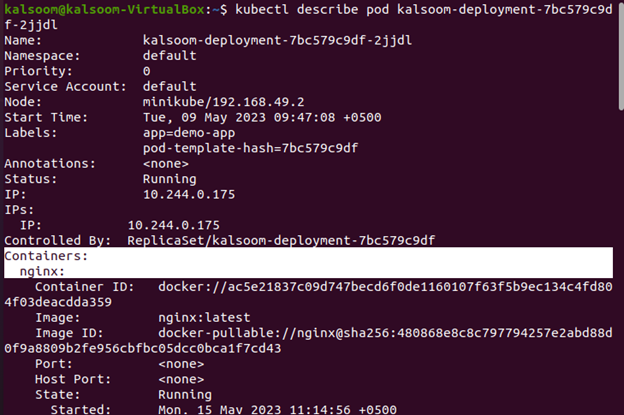
In the given output screenshot, we mark the “nginx” container in the pod. In this example, the whole details like name, IP address, and Annotations that are applied on the pod are easily fetched.
Step 4: Fetch the Logs of the Specific Pod in Kubernetes
In this step, we run the following command in our terminal to get the logs of the selected pod:
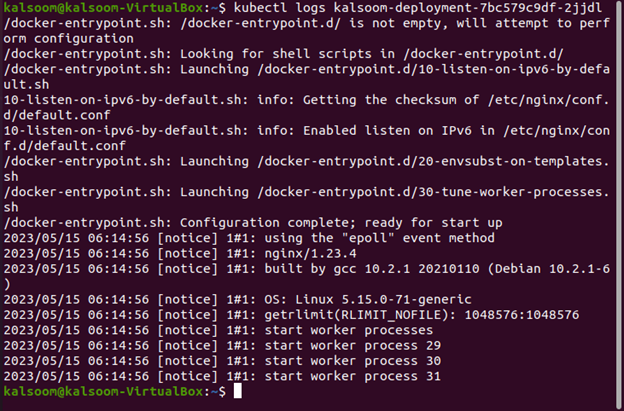
In the given output screenshot, we can see that all the logs inside the specific pod are displayed. The logs included which date and time we performed which type of tasks. The status of action are also displayed. You can see all the log details in the given output.
Step 5: Display the Logs for the Container and Instance
In this step, we use the following command to get the logs of a specific container. For that, we run the following command in the kubectl command line tool:
When you execute this command, it shows the following output:
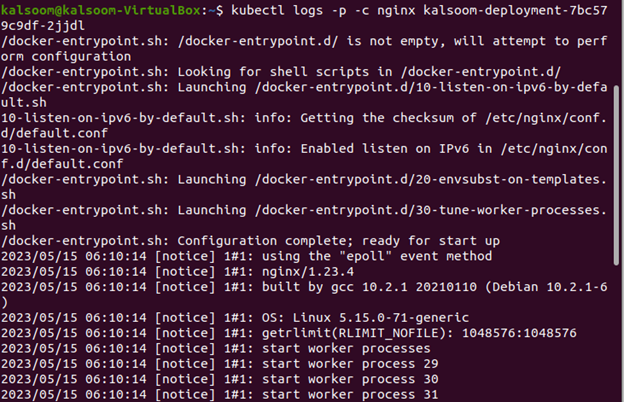
Several flags are used in this command including the –p flag which prints the container logs, and the –c flag which displays the container’s previous instance. When a cluster includes numerous containers, we use the -c flag to choose the particular ones. The given screenshot explains the detailed view of the nginx container’s logs.
Step 6: Stream the Logs for the Container
We will learn how to stream the container logs in Kubernetes in this step. The -f flag in the command that is shown in the following illustration tells the program to stream the logs, and the -c option is helpful when there are several containers to pick from. To display the stream logs on the screen, the command that is listed in the following is executed:
The result of the provided command is attached here:
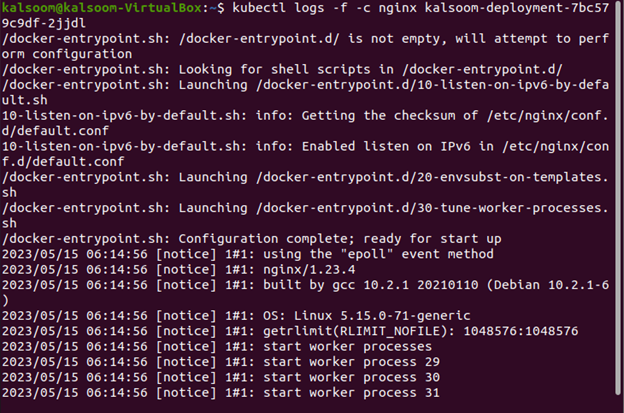
In this screenshot, we can see the detailed log stream of containers like the name of the process and which is pending or in the running state process.
Step 7: Display the Recent Lines of Logs
In this step, we use the following command to print the recent lines of code that are related to logs. The following script is executed:
Run the command. The output is attached in the following for your understanding:
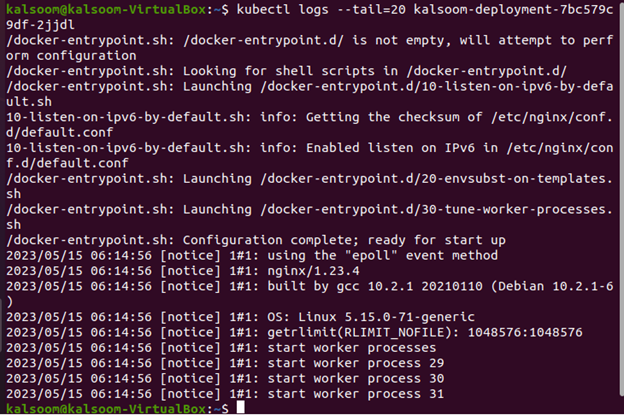
In this command, we use the different flags like the “—tail=20” command shows to print twenty recent lines of logs. The –c flag is useful in a case we have many containers and decide to choose a specific container.
Step 8: Display the Logs of the Last Hour
In this step, we run another command to display the logs of the last hour of the container whose name is “Nginx”. The following command is executed to print the last hour’s written logs:
Run this command on your kubectl command line tool. The output that we received in our case is attached in the following:
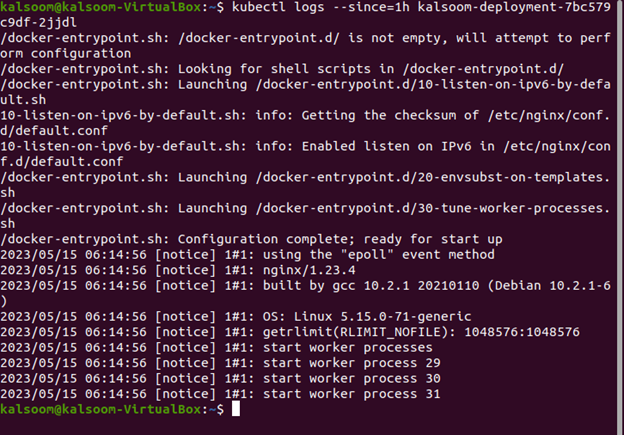
In this screenshot, we can see that the last date is the same and it shows the last hour logs of the “kalsoom-deployment-7bc579c9df-2jjdl” pod.
Conclusion
The “kubectl logs” command is covered in this article. It is very helpful for any software to monitor its occurrences. In Kubernetes, the “kubectl logs” command is used to keep track of the application’s performance, and through this, we got the text-based data stored in the logs of every pod’s process. We can use this command for different purposes such as error testing and debugging, troubleshooting, maintaining the actions that are in the queue, etc. This article broke down each process step-by-step and demonstrated how to use this command. For your convenience, each step is described in detail and includes the necessary screenshots.