Grafana, on the other hand, is an open-source data visualization and monitoring tool. It allows you to create interactive dashboards and visualizations from various data sources including databases like PostgreSQL. In addition, Grafana supports a wide range of data storage systems which makes it a flexible choice to monitor and analyze the data.
Integrating PostgreSQL with Grafana can provide powerful insights and visualizations of your database’s performance and metrics. For example, Grafana can monitor the database activity, query performance, resource utilization, and other relevant metrics. In addition, it provides a user-friendly interface to design and customize the dashboards, charts, and alerts based on your PostgreSQL data.
In this tutorial, we will learn how to install Grafana and configure it to monitor the PostgreSQL server in simple steps.
Requirements:
Before we can proceed with this tutorial, ensure that you have the following:
- Installed PostgreSQL Server on your system
- Linux-based System
- Administrative permissions on your server
Install Grafana
The first step is to install and configure Grafana on your system. Then, you can follow the commands that are provided in the following:
Ubuntu/Debian
$ wget https://dl.grafana.com/enterprise/release/grafana-enterprise_9.5.2_amd64.deb
$ sudo dpkg -i grafana-enterprise_9.5.2_amd64.deb
Red Hat, CentOS, RHEL, and Fedora
OpenSUSE and SUSE
$ sudo rpm -Uvh grafana-enterprise-9.5.2-1.x86_64.rpm
Once the installation is complete, start the Grafana service using the following command:
Once the server runs, access the Grafana web interface by opening a web browser and navigating to http://localhost:3000. If you’re accessing Grafana from a different machine, replace the localhost with the IP address or hostname of the Ubuntu system.
Provide the default username and password as admin/admin on the Grafana login page. Grafana may require you to change the credentials.
Connect Grafana in PostgreSQL
Once the Grafana server is running and the PostgreSQL server is ready, we can connect the server to the Grafana monitoring system.
Navigate to the “Configuration” section and select “Data Sources” in the Grafana web interface.
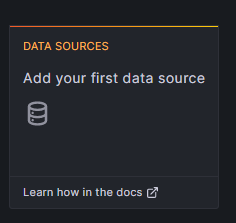
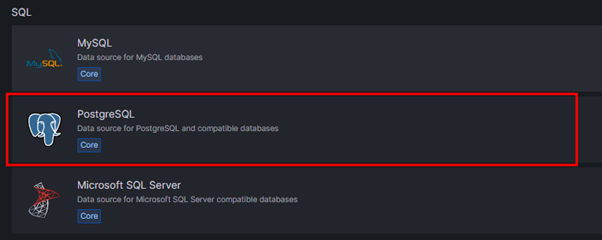
Next, click “Add data source” and choose “PostgreSQL” as the database type.
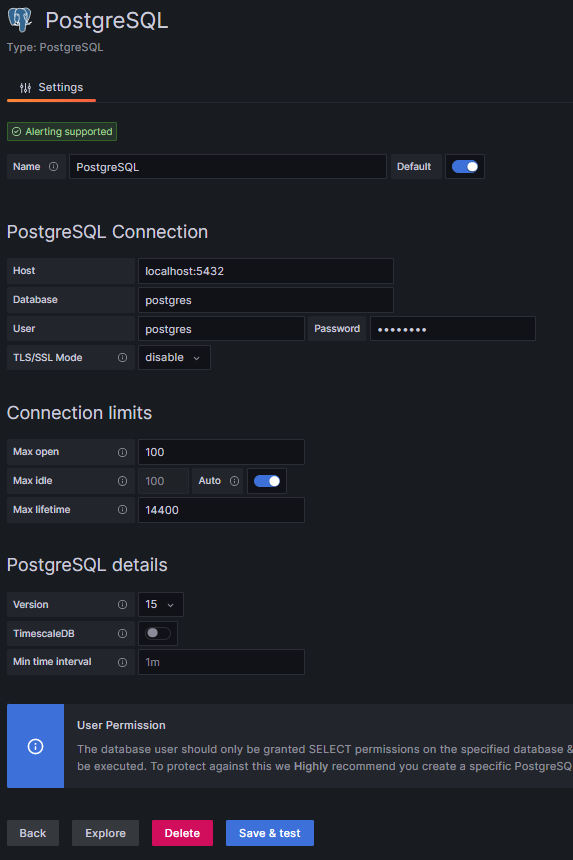
Finally, provide the necessary connection details including the hostname, port, database name, username, and password.
Once completed, you can navigate to the “Explore” section to monitor the query performance in the PostgreSQL database.
You can create queries to fetch the data from the database and design the dashboards to visualize the data. Grafana provides a query builder and rich visualization options to make meaningful representations of your PostgreSQL data.
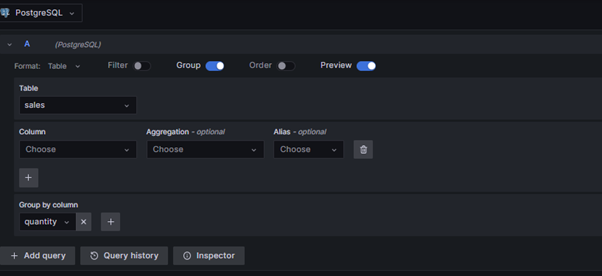
The given example demonstrates how you can query the data from a given table including aggregation, grouping, filtering, and more.
Conclusion
We explored how to use and connect the PostgreSQL server with the Grafana server which allows us to monitor the performance of a query in the server.