In MATLAB, the axis range of a plot determines the visible range of data along the x-axis and y-axis. Adjusting the axis range can be useful for focusing on specific regions of interest or improving the visualization of data. This article will guide you through different methods to change the axis range in MATLAB, along with examples for each technique.
Method 1: Using the axis() Function
The axis()function in MATLAB allows you to manually set the range of the x-axis and y-axis, here’s an example:
x = linspace(0, 10, 100);
y = sin(x);
% Plot the data
plot(x, y);
% Set the axis range
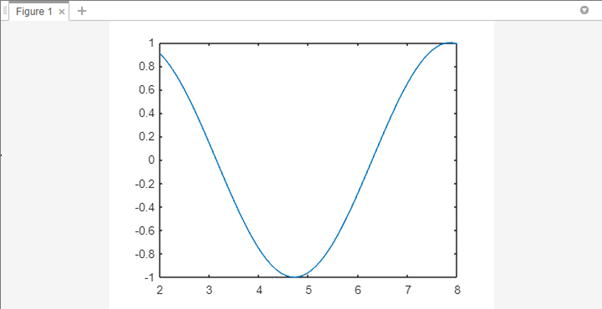
axis([2, 8, -1, 1]);
In this code, the axis() function is used to specify the axis range. The format for the arguments supplied to the axis() is [xmin, xmax, ymin, ymax], where xmin and xmax specify the intended range for the x-axis and ymin and ymax specify the range for the y-axis. The resulting plot will display the data within the specified axis range:
Method 2: Using the xlim()and ylim() Functions
Alternatively, you can use the xlim() and ylim() functions to change the axis range individually, here’s an example:
x = linspace(0, 10, 100);
y = sin(x);
% Plot the data
plot(x, y);
% Set the x-axis range
xlim([2, 8]);
% Set the y-axis range
ylim([-1, 1]);
In this code, the xlim() function sets the range of the x-axis, while the ylim() function sets the range of the y-axis. By specifying the desired limits for each axis separately, you can customize the axis range according to your needs.
Conclusion
MATLAB provides various methods to change the axis range, allowing you to customize the visible range along the x-axis and y-axis. By employing techniques such as the axis() function, xlim(), and ylim() functions, you can effectively adjust the axis range to suit your needs and enhance the interpretation of your data.


