MATLAB is a tool for performing numerical computations and writing code, created by MathWorks. It is used in engineering and mathematics to analyze data, create models, and run simulations.
Vectors are an array of a number that stores different data. MATLAB allows us to plot these vectors using different techniques. This article covers different ways of plotting a MATLAB vector.
What is a Vector
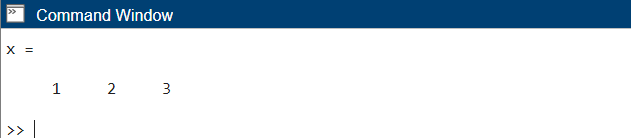
A vector is a single-dimension array of numbers arranged in a single line or row. The square brackets [ ] can define a new vector in MATLAB. For example, to create a row vector with the elements 1, 2, and 3, we can use the following command:
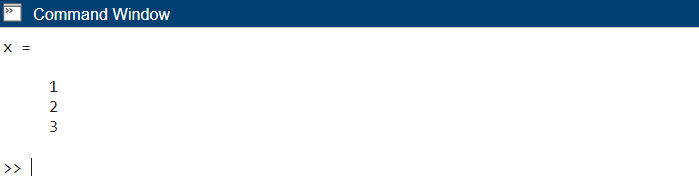
To create a column vector with the same elements, we can use a semicolon (;) to separate the elements:
How to Create a Vector in MATLAB
In addition to using square brackets to create vectors manually, several built-in functions in MATLAB can be used to create vectors. Some common functions include:
-
- linspace: creates a linearly spaced vector with a specified number of elements between two endpoints.
- logspace: creates a logarithmically spaced vector with a specified number of elements between two endpoints.
- colon: creates a regularly spaced vector with a specified increment between two endpoints.
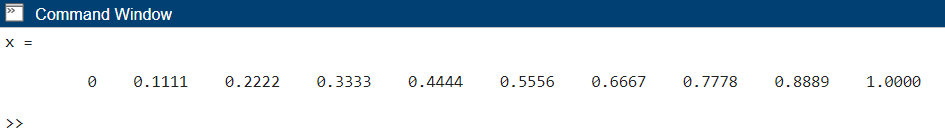
For example, to create a vector with 10 elements between 0 and 1, we can use the linspace function:
Plotting a Vector in MATLAB
Basic Plotting
To plot a vector the plot function is used. Syntax for plotting vector using plot() is:
Here both x and y represent two vectors of equal length. The plot function will create a two-dimensional line plot of the data in y versus the data in x.
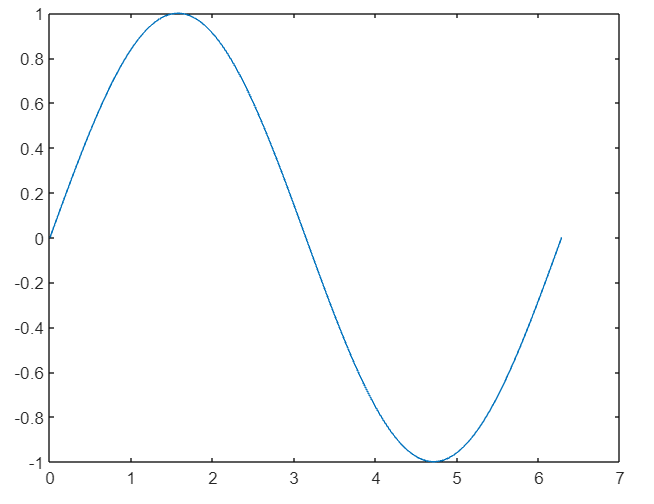
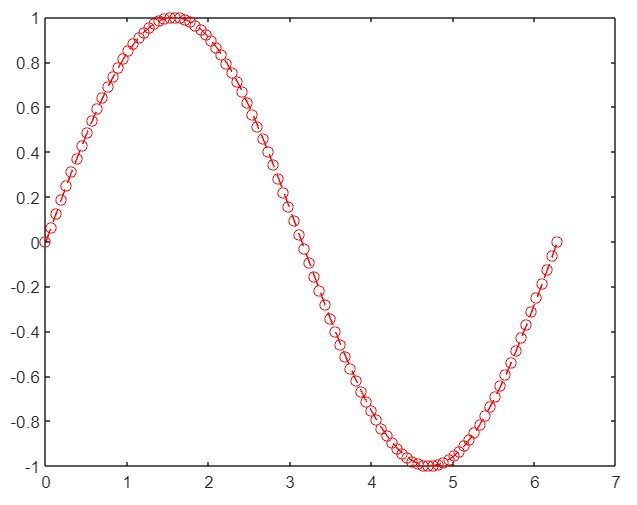
For example, now we will plot sine function between 0 and 2π:
y = sin(x);
plot(x,y)
This will create a plot of the sine function with x on the x-axis and y on the y-axis.
Customizing the Plot
MATLAB provides many options for customizing plots. Some common options include changing the line style, color, and marker type. These options can be specified using name-value pairs when calling the plot function.
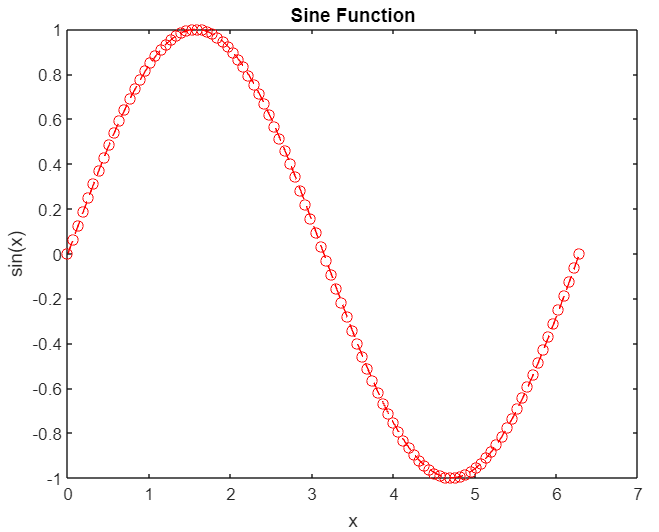
For example, now we will create a red dashed line plot with circle markers:
y = sin(x);
plot(x,y,'r--o')
The [r–o] argument specifies that the line should be red (r), dashed (–), and have circle markers (o).
Adding Titles and Labels
To add titles and labels to plots in MATLAB, we can use the title, xlabel, and ylabel functions. These functions add text to the plot to provide details about the data being displayed.
For example, now we will add a title and axis labels to our sine plot:
y = sin(x);
plot(x,y,'r--o')
title('Sine Function')
xlabel('x')
ylabel('sin(x)')
This will add a title above the plot and labels on the x- and y-axes.
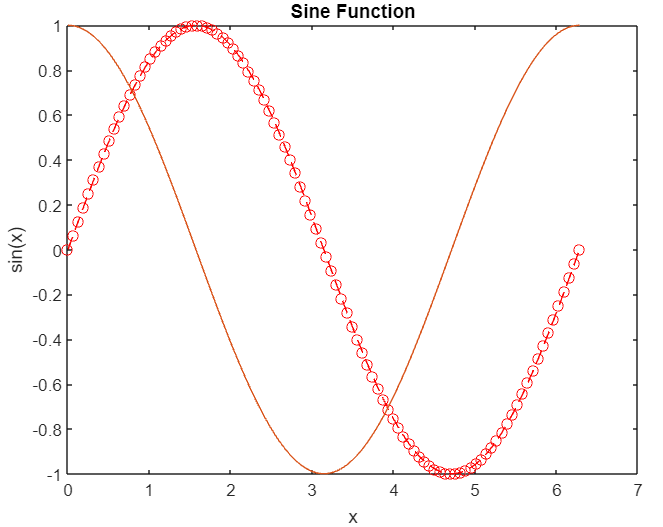
Multiple Plots on One Graph
MATLAB displays multiple plots on one graph using the hold on command. This command tells MATLAB to keep the current plot when adding new plots.
For example, now we will add a cosine plot to our sine plot using the hold on command:
y2 = cos(x);
plot(x,y2)
This will add a cosine plot to our existing sine plot.
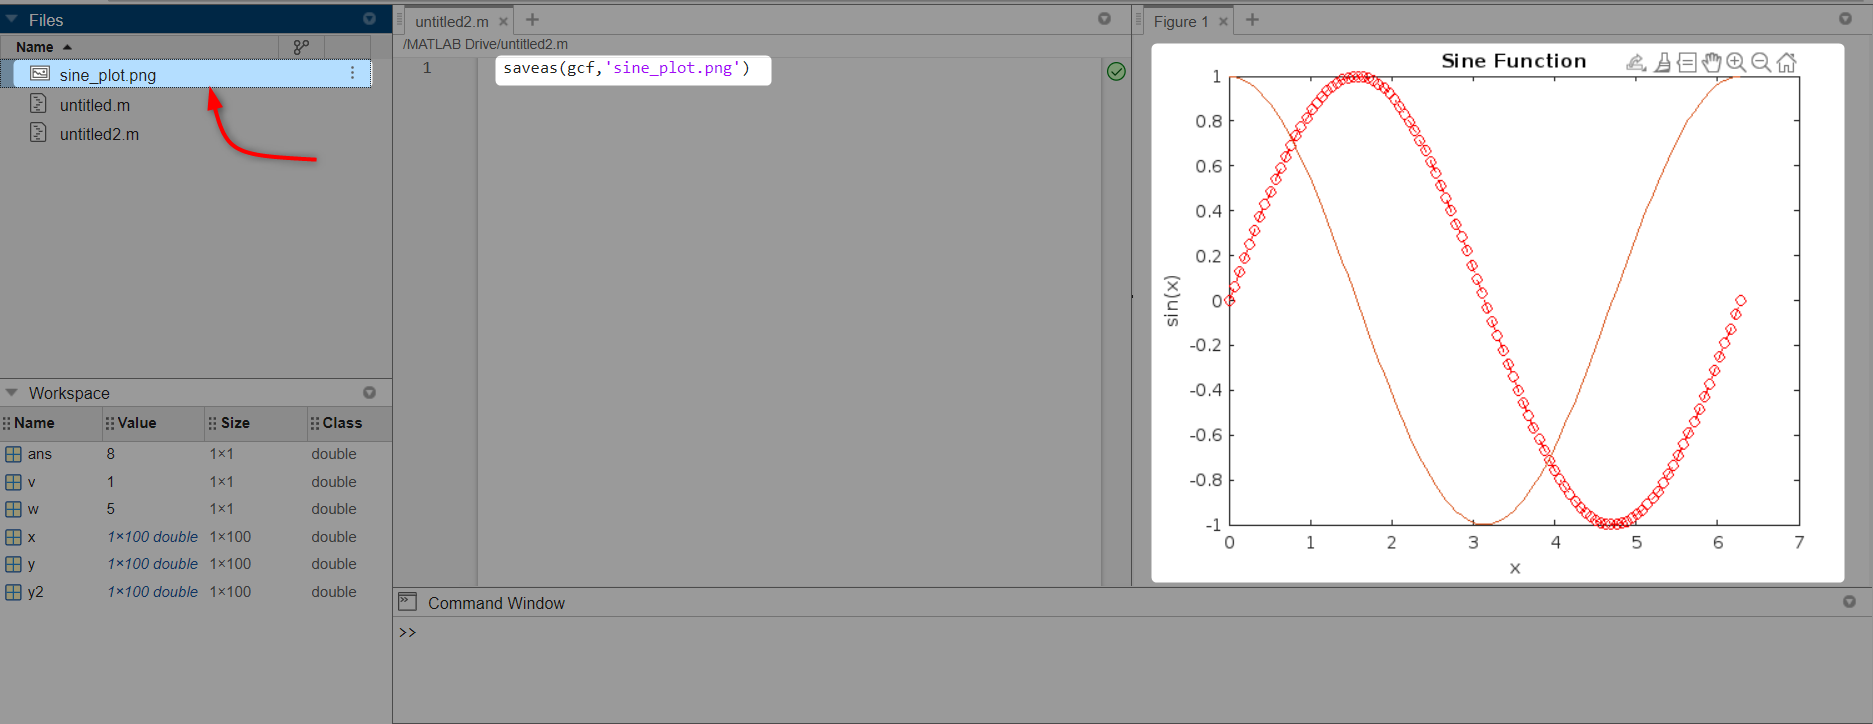
Saving and Exporting Plots
MATLAB provides several options for saving and exporting plots. To save a plot as an image file (such as PNG or JPEG), we can use the saveas function.
The basic syntax for this function is:
where gcf refers to the current plot and filename represents the name we want to save this file with.
For example, to save sine plot as a PNG image run the following command:
Conclusion
Vectors are an array of a number that stores different data. MATLAB can plot these vectors using different techniques. Here we covered the plot() function for plotting the MATLAB vectors. Using this function, we can even customize the MATLAB plot of vectors by adding x and y axis labels. Further, we covered how we can plot multiple vectors on a single plot using the hold command.