What are Chrome DevTools
Chrome DevTools is a set of tools that are designed to help you in front-end development. You can enhance your website by addressing styling errors and assessing changes in real-time. Learn how to utilize Chrome DevTools to use this tool as a sandbox for experimenting with the website styles and code. You are not required to do any further configuration because Chrome DevTools are embedded inside your web browser. These developer tools are highly recommended since they assist you in editing the style of your website, completing DOM-related operations, debugging JavaScript, and improving website speed.
Now, let’s understand few things before we move towards the use of Chrome DevTools:
- Web browsers execute JavaScript, CCS, and HTML, these are the three languages that Chrome DevTools are intended to use.
- Anyone can manipulate the website code using Chrome DevTools. The applied modifications will only be viewed in your browser and vanish as you soon refresh that webpage. These Devtools assist you in determining which changes are required. You will need to access the back-end code to make those changes permanent.
Why you should use Chrome DevTools
By permitting users to edit websites directly in the web browser, Google Chrome DevTools saves your time, and we can not deny this fact. To justify the statement, check out the below-given list of Chrome DevTools aspects that can help you improve your web development:
- Efficiency: Chrome DevTools are embedded into your web browser, providing you the facility to edit websites or content without switching tabs.
- Panels: Using Chrome DevTools, you can play around with various page elements and extract the information, but keep in mind that any modifications you make will be lost if you close your tab without storing them.
- Optimization: You can also execute Audits through which you can get a report related to the performance. On the web browser, you will get suggestions on enhancing the site’s loading speed.
- Debug JavaScript: The user can identify the errors by pausing your running website code and pinpointing the exact instant when the script fails to run correctly.
How to open Chrome DevTools
Chrome Developer Tools can be accessed using keyboard shortcuts:
- Press “CTRL+SHIFT+J” to open Chrome DevTools on Windows, Chromebook, and Linux.
- For macOS, hit the “CMD+SHIFT+J” or “CMD+SHIF+C” shortcut.
Using Chrome’s menu:
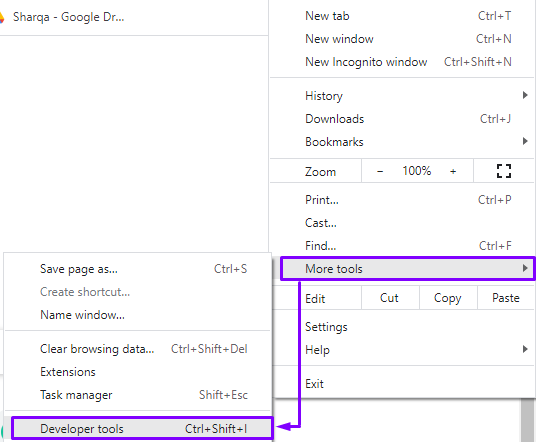
Explore “More Tools” > “Developer Tools” in the Chrome menu. It will lead you to the Chrome DevTools Window:
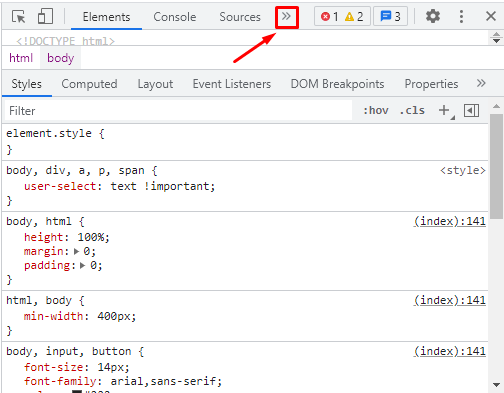
The Developer Tools window has three tabs at the top, plus a further six that you may see by clicking the >> sign next to them:
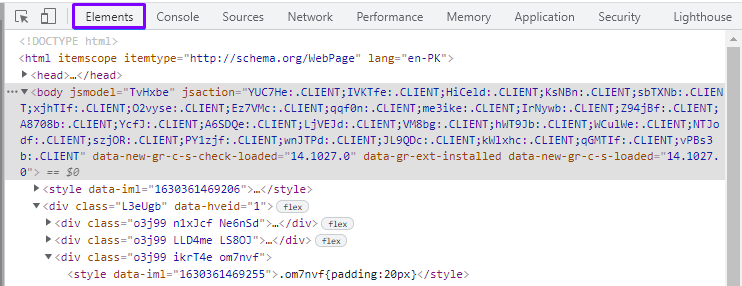
Here are the names of tab showing in our panel: Elements, Console, Sources, Network, Performance, Memory, Application, Security, Lighthouse, Cookie Editor, and AdBlock:
Elements tab in Chrome DevTools
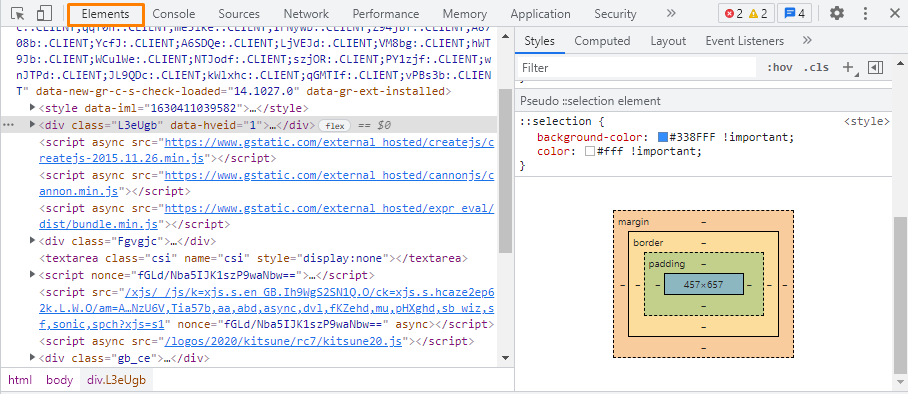
Chrome DevTools panel opens with the “Elements” tab by default. It displays the HTML and inline CSS utilized for developing the web page you are viewing:
Console tab in Chrome DevTools
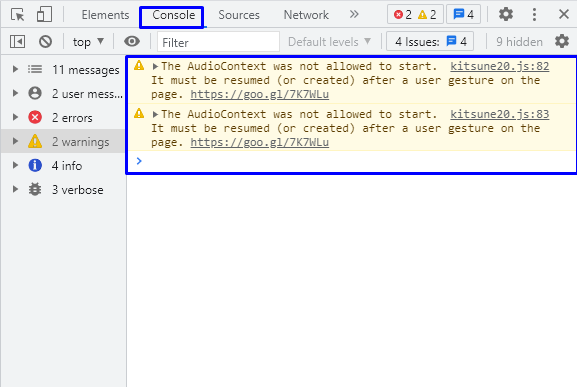
The Console tab handles JavaScript. It provides details related to the elements present on a web page. You can utilize Console for writing JavaScript code for the web page interaction and sending messages to yourself. These messages will appear in the Console window when the JavaScript will execute:
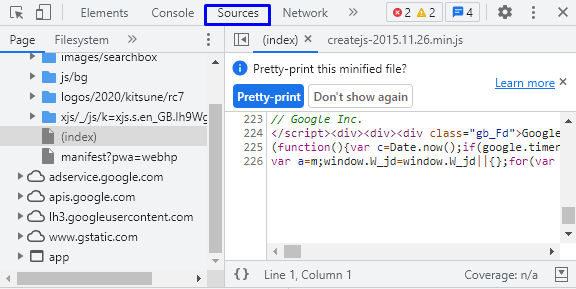
Sources tab in Chrome DevTools
The Sources tab displays and permits you to inspect all of the files that are used to create the website:
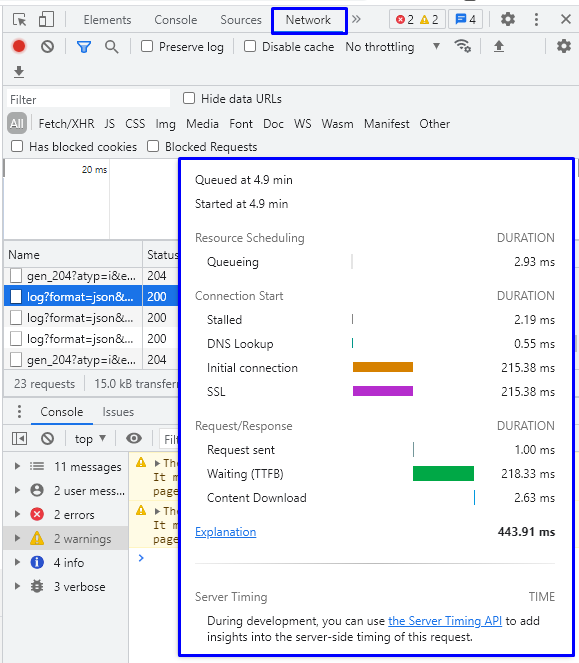
Network tab in Chrome DevTools
The Network tab displays all of the loads for the current URL you are viewing. You get detailed information about load objects, including the duration of DNS lookup, initial connection, SSL, etc. Check out the below-given image to know about loaded object attributes:
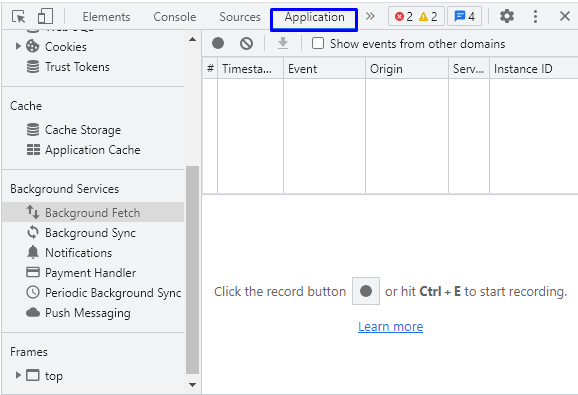
Application tab in Chrome DevTools
The Application tab displays the contents of your browser storage, including in-browser databases such as local storage, Web SQL, etc. It also permits you to have fine-grained control over your cookies:
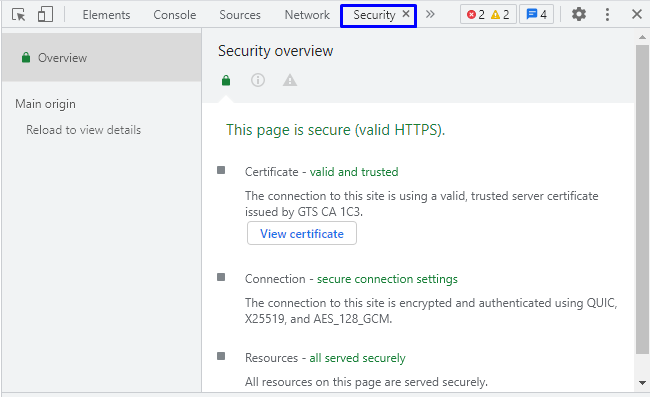
Security tab in Chrome DevTools
The Security tab provides basic security information, such as the TLS state of a website and its HTTPS certificate:
Lighthouse tab in Chrome DevTools
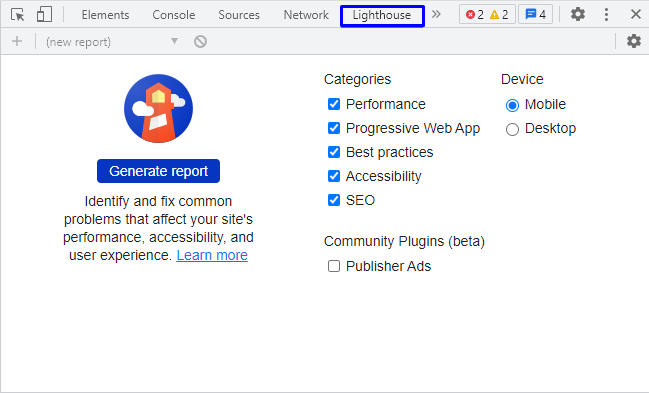
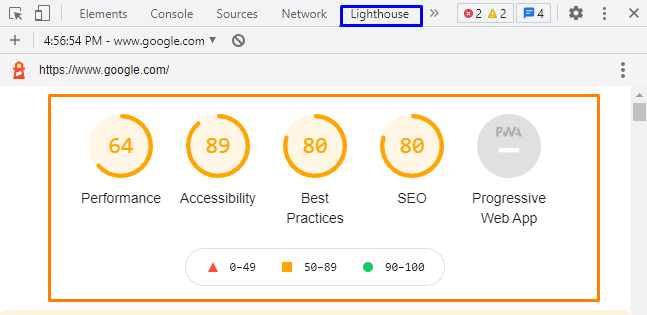
Lighthouse helps the Chrome DevTools user to generate reports regarding the website structure and functionality, which assists the developers to improve the performance:
How to use Chrome DevTools for inspecting page tags
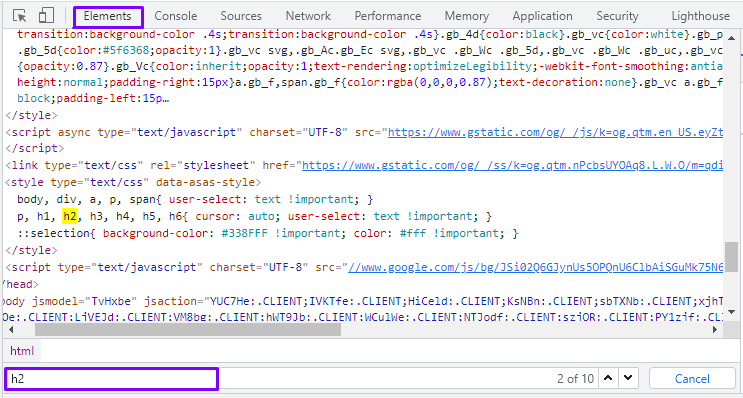
h1 and h2 tags are some of the most significant parts of on-page SEO. Once you figure out the pages with an unoptimized image as the h2 or pages with four h2 tags, you will understand the complexity of this matter.
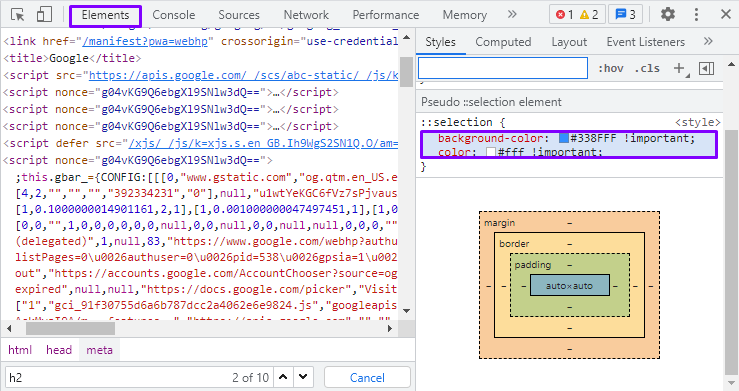
You can use the Chrome DevTools for inspecting the page tags. To do so, press “Ctrl-F” or “CMD+F” to search in the Elements tab, and type “h2” to see your page tags:
How to use Chrome DevTools for editing CSS
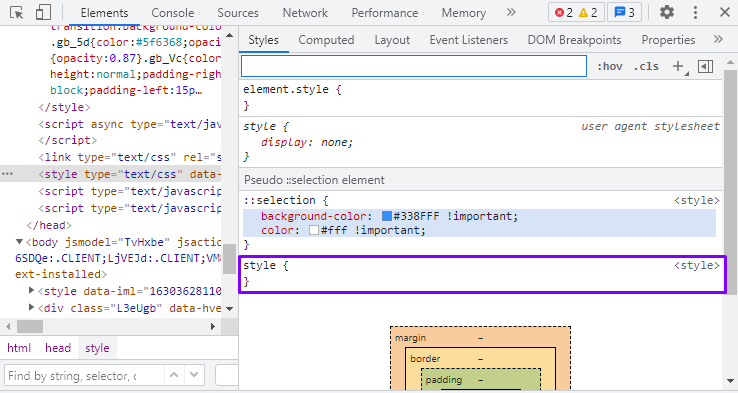
Chrome DevTools permits you to edit a page’s CSS directly in your browser. You can experiment with fonts, color schemes, and everything else that is defined by CSS:
You can also new styles to the Web pages using DevTools:
Conclusion
Chrome DevTools is a complete developer toolkit that comes pre-installed with the Chrome browser. These tools permit users to change web pages, identify problems and create better websites in real-time. You can benefit from Chrome DevTools even if you are not a web developer. This article discussed Chrome Devtools, its tabs, and how to use these DevTools on your web browser. Now, feel free to explore Chrome DevTools.

