Elasticsearch is a big data solution, analytics database, and search engine to extract information from a huge data pool. The user needs an understanding of the data located in the database to get value from it and take actions based on it. Elasticsearch aggregations enable the user to get an understanding of the data as it displays data from multiple indexes and displays it as a singular index.
This guide will explain the metric aggregation in Elasticsearch.
What is Metric Aggregation in Elasticsearch?
Metric aggregation summarizes the data as statistics, analytics, and metrics to calculate the sum, average, count, etc. from field values. It scans the index from the database and displays the statistics of the database in the form of metrics to find the stats about a particular field.
Types of Metric Aggregation
Metric aggregation has different application and all of them belongs to the following types:
-
- Single-Value Metric Aggregation: (min, max, avg, value_count, cardinality, etc.)
- Multi-Value Metric Aggregation: (stats, extended stats, percentile, geo_bound, etc.)
Now start the explanation of the types of metric aggregation with examples:
Single-Value Metric Aggregation
The following section contains examples of single-value aggregation.
Example 1: Sum Aggregation
The following code uses the logs sample data from the Kibana to get the sum metrics aggregation of the index using the “bytes” field:
{
"size": 0,
"aggs": {
"sum_total_bytes": {
"sum": {
"field": "bytes"
}
}
}
}
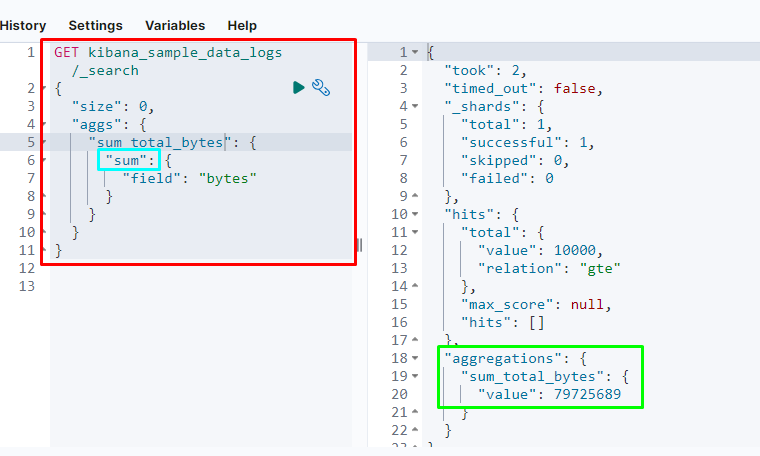
The above screenshot displays the output of the sum in single-value which has the value of “79725689”.
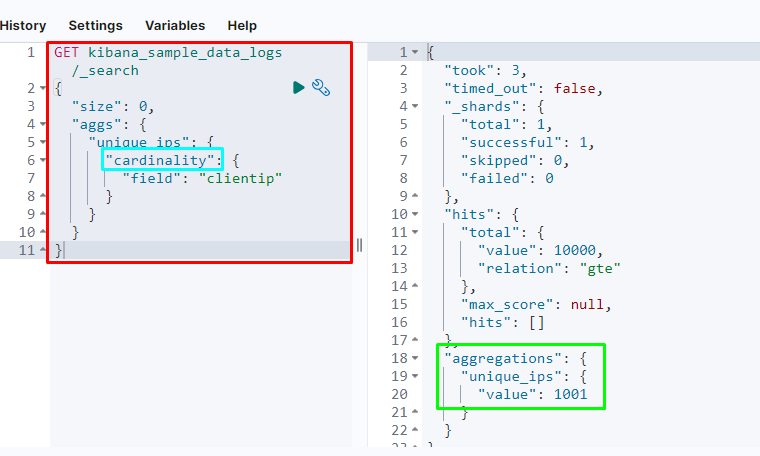
Example 2: Cardinality Aggregation
Cardinality metrics aggregation provides the approximate count of the documents in the “clientip” field as the following code snippets contain the code:
{
"size": 0,
"aggs": {
"unique_ips": {
"cardinality": {
"field": "clientip"
}
}
}
}
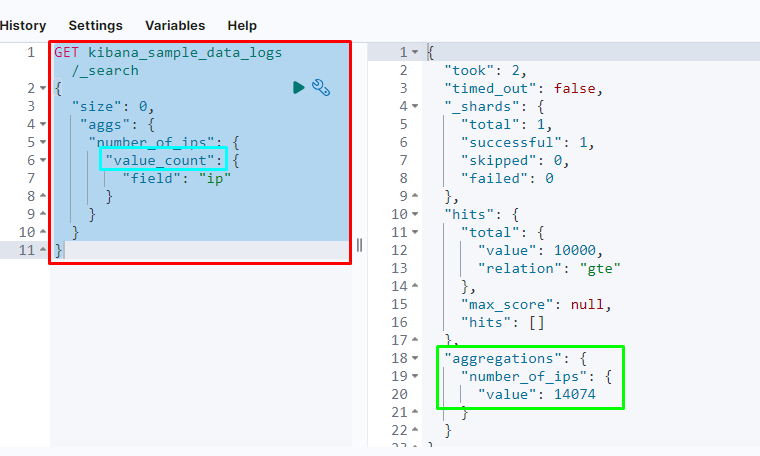
Example 3: Value Count Aggregation
Another single-value metrics aggregation is the “value_count” aggregation which provides the number of values an aggregation is based on. The following code uses the value_count aggregation to count the number of values available in the ip field from the logs index:
{
"size": 0,
"aggs": {
"number_of_ips": {
"value_count": {
"field": "ip"
}
}
}
}
The single-value metrics aggregation returns a single metric from the specific field in the database’s index. The next section is the multi-value aggregation to get multiple statistics from the index:
Multi-Value Metric Aggregation
The following section contains an example of multi-value aggregations in Elasticsearch:
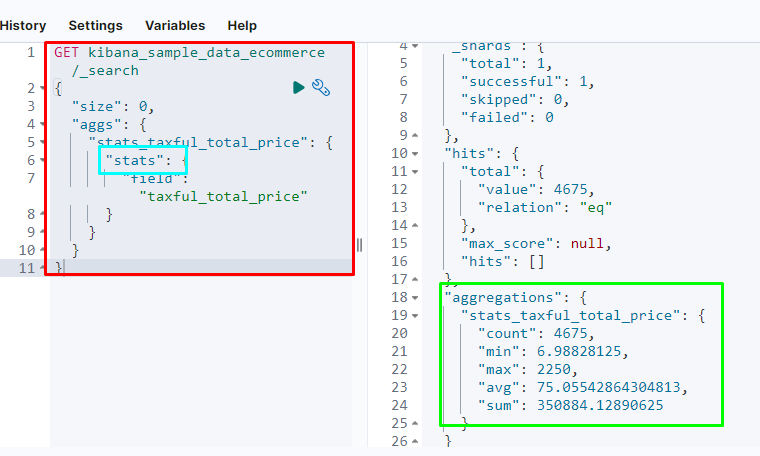
Example 1: Stats Aggregation
The following code uses “stats” aggregation on the “ecommerce” index using the “stats_taxful_total_price” field to get the sum, min, max, and many more metrics of the data:
{
"size": 0,
"aggs": {
"stats_taxful_total_price": {
"stats": {
"field": "taxful_total_price"
}
}
}
}
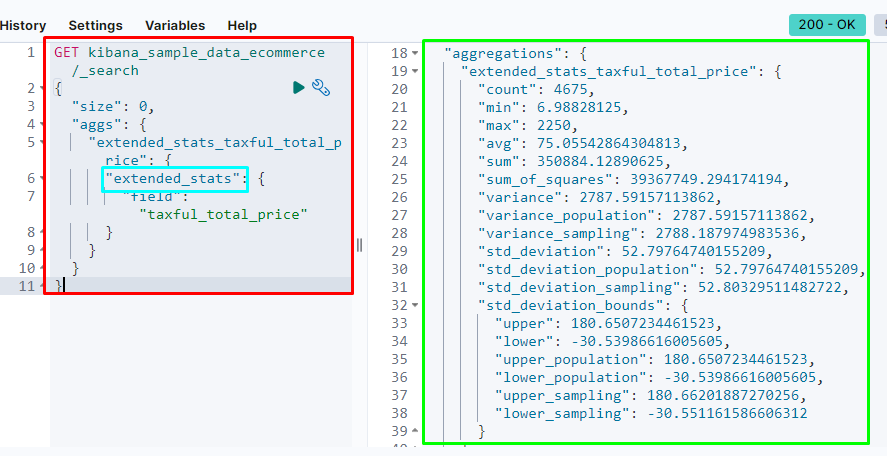
Example 2: Extended Stats Aggregation
The “extended_stats” aggregation is exactly as its name and it extends the number of metrics displayed in the stats aggregation. The following code uses extended_stats aggregation and the resultant metric displays a list of stats containing variance, standard deviation, skewness, range, and many more:
{
"size": 0,
"aggs": {
"extended_stats_taxful_total_price": {
"extended_stats": {
"field": "taxful_total_price"
}
}
}
}
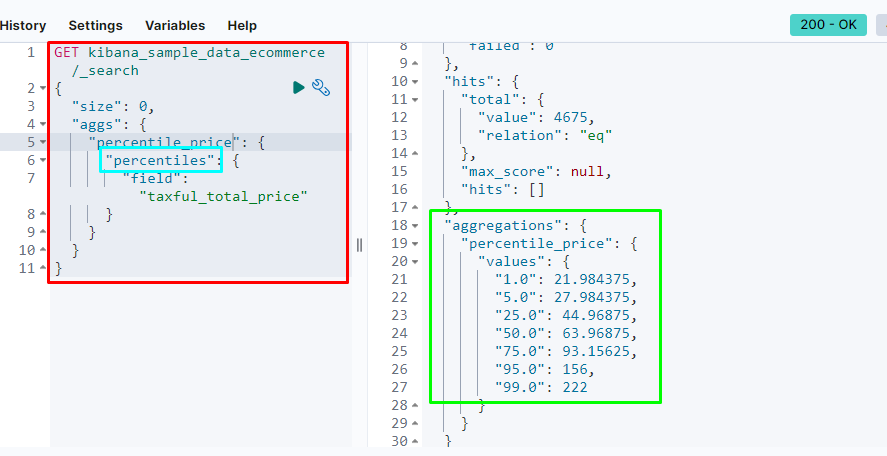
Example 3: Percentile Aggregation
The percentile aggregation displays the diversity of the data and also determines the outliers present in the data. An outlier is an extreme value from both sides of the range that can disturb the statistics of the table for its average metric:
{
"size": 0,
"aggs": {
"percentile_price": {
"percentiles": {
"field": "taxful_total_price"
}
}
}
}
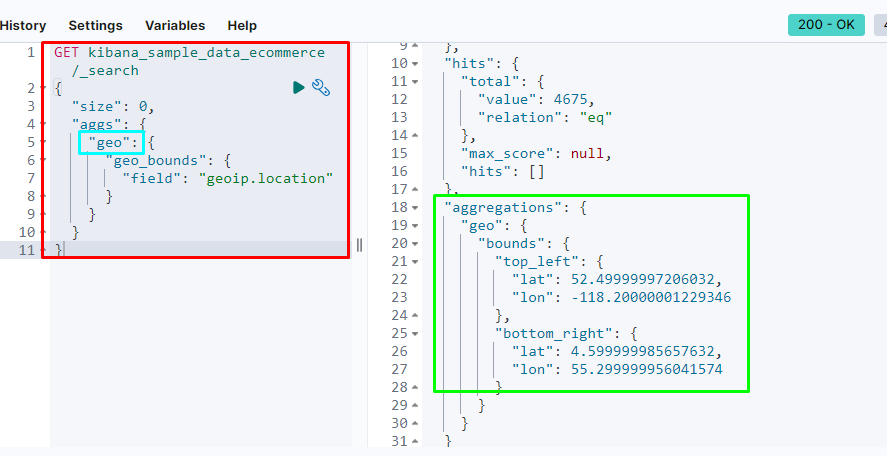
Another multi-value metric aggregation is the geo_bounds aggregation that displays the latitude and longitude around the “geoip.location” field as the following code suggests:
{
"size": 0,
"aggs": {
"geo": {
"geo_bounds": {
"field": "geoip.location"
}
}
}
}
That’s all about the metric aggregation in Elasticsearch.
Conclusion
Metric aggregation is used to calculate the diversity of the data and also it provides a better understanding of the data by displaying it in statistics. It calculates the sum, average, diversity, variance, and many more metrics of a specific field from the index. Metric aggregation is of two types such as single-value metric which displays a single metric from the field and multi-value metric to display multiple stats about the data.