As a database administrator, you will encounter instances where you need to monitor and gather information about the nodes in your cluster. Collecting such data will enable you to perform diagnostics and troubleshooting on your cluster.
In this post, you will learn how to use the Nodes information API to gather detailed information about the nodes available in your cluster.
Elasticsearch Nodes Info API
The Node information API enables us to get the usage information about the nodes in the cluster. The request syntax is as shown below:
GET /_nodes/<node_id>/stats
GET /_nodes/stats/<metric>
GET /_nodes/<node_id>/stats/<metric>
GET /_nodes/stats/<metric>/<index_metric>
GET /_nodes/<node_id>/stats/<metric>/<index_metric>
The API allows us to fetch all the metric information about all the nodes or a specific node. We can also fetch a specific metric of a given node, etc. By default, the API returns all the information about the nodes.
The Node Information API requires you to have the monitor or manage privileges on the cluster.
You can also pass the following path parameters to the request. These parameters allow you to control what information is returned by request or how the data is formatted.
The accepted path parameters include:
- Metric – this parameter allows you to specify what metrics are returned by the request. The accepted values include:
- adaptive_selection – shows the information about the adaptive replica.
- Breaker – shows information about the field data circuit breaker.
- Discovery – shows discovery information.
- Fs – shows filesystem information.
- HTTP – shows HTTP connection statistics
- Indexing_pressure – shows the node indexing load.
- Indicies – returns the index statistics such as document count, deletion times, search times, etc.
- Ingest – shows ingest processing information.
- jvm – shows OS stats.
- Process – shows process statistics.
- Thread_pool – shows information about each thread pool.
- Transport – represents transport statistics.
- Index_metric – specifies metric returned for the index. Accepted values include:
- Completion
- Docs
- Warmer
- Translog
- Fielddata
- Flush
- Get
- Indexing
- Store
- Segments
- Search
- Recovery
- Refresh
- Node_id – target node/nodes
Example 1
The following example shows detailed information about all the nodes in the cluster:
curl -XGET “http://localhost:9200/_nodes/stats?pretty=true” -H “kbn-xsrf: reporting”
The resulting output is as shown:
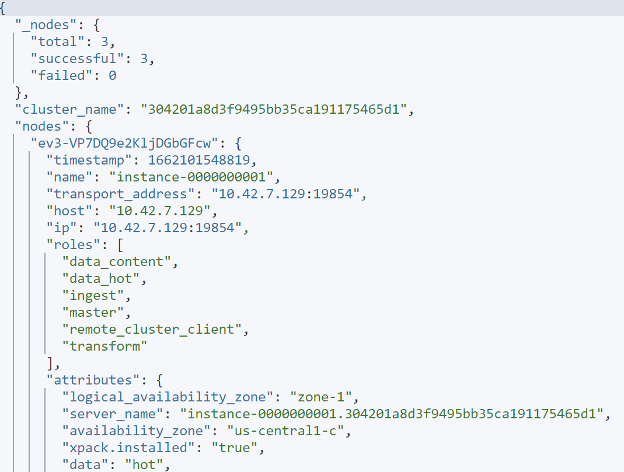
Note that the above screenshot contains truncated information.
Example 2
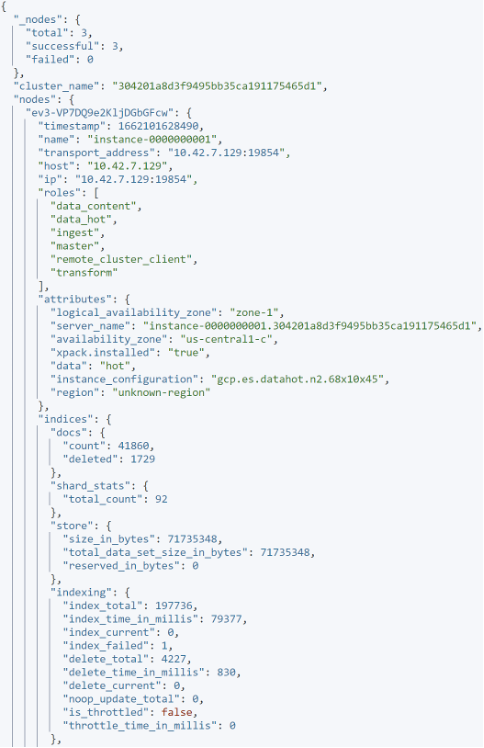
We can fetch specific information about the nodes by specifying the target metric. For example, to show the indices in the nodes, we can run:
Example output:
Example 3
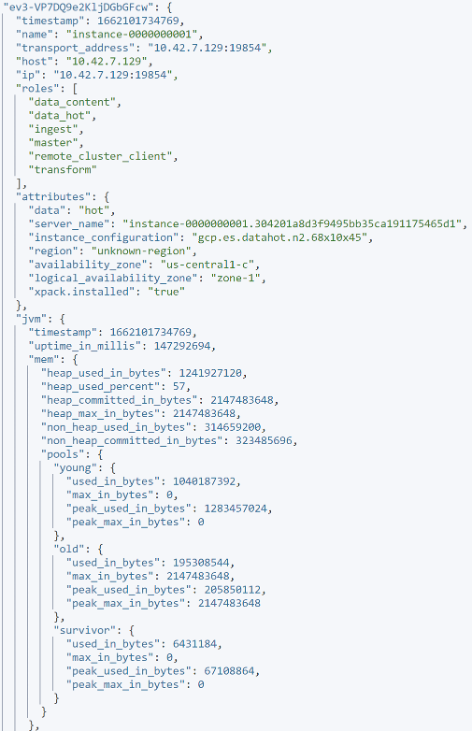
We can also fetch the OS information by fetching the JVM metric.
Example 4
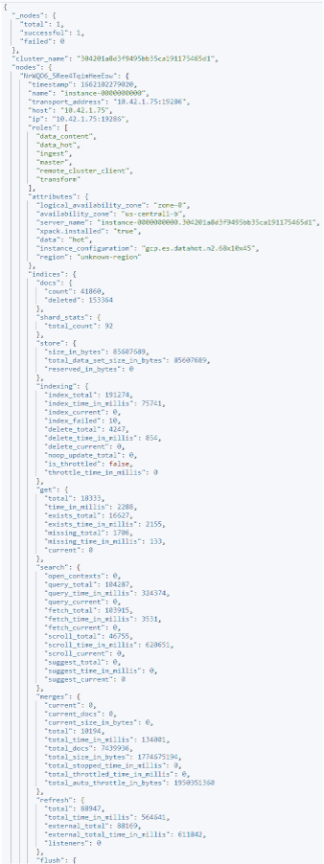
We can also target specific nodes by using their IP addresses. For example:
This should return the node information with the specified IP address. An example output is as shown below:
Conclusion
In this post, you learned how to gather specific node information from an Elasticsearch cluster using the node info API.