Valgrind is operating system dependent as it is executable only on the Linux operating system. Valgrind is a collection of memory detection tools that are all open source. It is widely used and more powerful than other tools like memwatch, mtrace, etc., which perform the same functions as Valgrind. Although C++ is a very powerful and useful programming language, it requires a lot of power for debugging and execution. Still, sometimes memory errors occur, which is a specific problem. Similarly, there exists another error that is a memory leak. Valgrind is a specific program that helps you to solve both problems.
Valgrind installation
When working on the Linux platform, many new programs are needed to execute some particular programs on that operating system. For example, while using a terminal, you need a snap, apt to carry out many other software installations. Similarly, Valgrind is also installed on the terminal by using a ‘sudo-apt’ command.
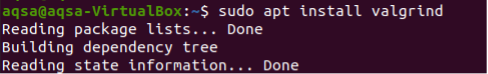
This will take some time, but in the end, it is successfully installed on your system.
Some instructions for the Valgrind usage
The program or application that is to be tested is added through a compiler that compiles the program. “-g” is used as it is also a compiler for C++ programs.
The resultant value of the detection record is displayed as an output on the terminal. In addition to this, the resultant value can be saved in a file.
If you want more instructions or need some help to use some specific command, you can execute Valgrind –h, giving you an interface of the help terminal.
We use a specific format for the indication of detection of the leaks in the memory: # Valgrind –tool=memcheck –leak-check=full ./file, –leak-check=full
Principle of Valgrind memory detection
Valgrind uses a virtual environment for the implementation of the programs. The program or application that is to be tested runs on this virtually created environment. Valgrind’s function is to monitor the application, its use, and the memory release in real-time and also record the information that may show some abnormalities in memory. In Valgrind, there is a memory detection component, Memcheck. It supports many functions. Some of them are listed below:
- Memory space is not allotted.
- Memory space access exceeded the given limit.
- Memory space is released repeatedly.
- The application of memory space and release of memory are not matched.
Memcheck can check many problems as it is the most powerful component of Valgrind.
- Variables that are not initialized
- A malloc() with the functionality of ‘any free()’
- Heap pointer that accesses invalid memory.
- Now we will explain the working of Valgrind through some examples
Uninitialized memory
This problem occurs when you are writing a program with the use of any single variable or array. And you forgot to declare and initialize the array at the start. And at the time of usage, you are not well aware of this issue of forgetting. This error is identified by Valgrind. To explain the example, we have taken a program in C++.
First step is to use the STD library.
Here you can see that the value of a variable is not assigned and is given to the array, and similarly, these values are printed by using a ‘for’ loop. Here we forgot to assign a value to a variable. The error will occur when an empty array is opted to display the values.

Now we will execute this code on the Ubuntu terminal. We will use a ‘g++’ compiler to compile the code. Unlike simple c code, here we will use the keyword of ‘Valgrind’s.
$ Valgrind ./file1
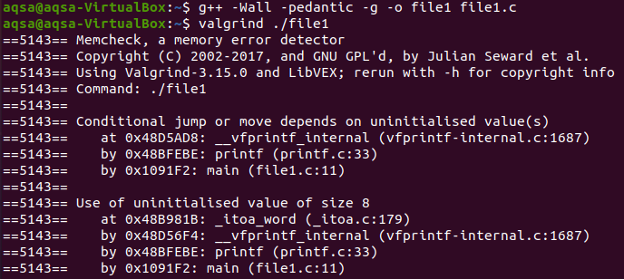
Now this command will bring a portion from memory utilized page. First, we will get some description about ‘Memcheck’. Then the details about the uninitialized value are shown. In this portion, you can see that the line number is mentioned where an error has occurred. Here the line number is ’11’.
Memory leaks detection
Suppose you have a program that contains malloc() no free (). This will lead to a memory leak. There is an example of a C++ source code.

In the main program, a pointer of character type is used with a malloc function. Even a small program is also responsible for memory leakage identification. Now we will see the output.
The output content matches with the output of the previous one in some aspects, so we have only displayed the memory leaks portion to have complete focus.
Now we will compile the above code and will execute it through a command.
![]()
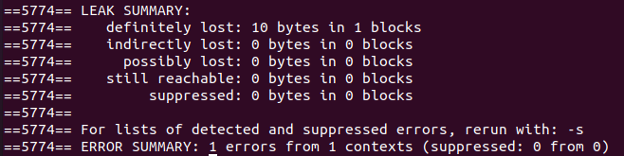
This command will show the following results. You can observe here that numbers of bytes that are lost are displayed. The line where the error has occurred is also displayed in the last line of the resultant values.

This result also contains the summary of Leakage, which explains total bytes lost either directly or indirectly; whatever the description is, it is explained briefly in the result.
Invalid memory access detection
Sometimes such conditions are encountered when the source code contains a bug, the pointer we use to access out of bound memory location. This error is detected by memcheck.
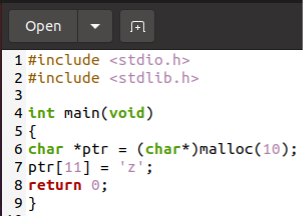
In this above-mentioned code, you can see that we have used a pointer ‘ptr’ that is trying to access a memory location that exceeds the boundary.

The output shows that the size is invalid. As we have declared an array of size [10]. And the pointer is accessing the slot of 11, which is out of range we have declared.
Dangling pointers operations detection
These are those pointers that point to the memory that is freed already.

Here we have first free the space; even after the space is freed, the code is trying to access the memory, which is pointed by a pointer.

Conclusion
‘How to use Valgrind c++’ is implemented on the Linux terminal. It comprises the basic concept, Valgrind types, its installation, instruction for usage, and some major functions of its components. Memcheck, as the major component of Valgrind, detects the error in the program, whether it is the case of memory leakage or uninitialized memory. All examples mentioned show the working of Valgrind, including malloc(). This article will be beneficial regarding the working and principles of Valgrind in the programming environment of C++.