To evaluate the performance of I/O devices, their efficiency with respect to time is calculated. In Linux, we use the iostat command to find out its usage of CPU and other connected Input/Output devices with respect to time. On the basis of these reports, the configurations of the I/O devices can be changed to optimize the load on the CPU.
The iostat command is helpful in monitoring the CPU and other I/O devices connected to it, in this write-up, we will discover more about the iostat command.
Installation of the iostat command in Linux
The iostat command is not pre-installed in Linux distributions but it comes with the default package, therefore, it can be installed in Linux using the package manager of the specific distribution. To install the iostat command on RedHat/CentOS/Fedora, use the command:
While on Ubuntu/Debian/Linuxmint based distributions of Linux, it can be installed by using the command:
Usage of iostat command in Linux
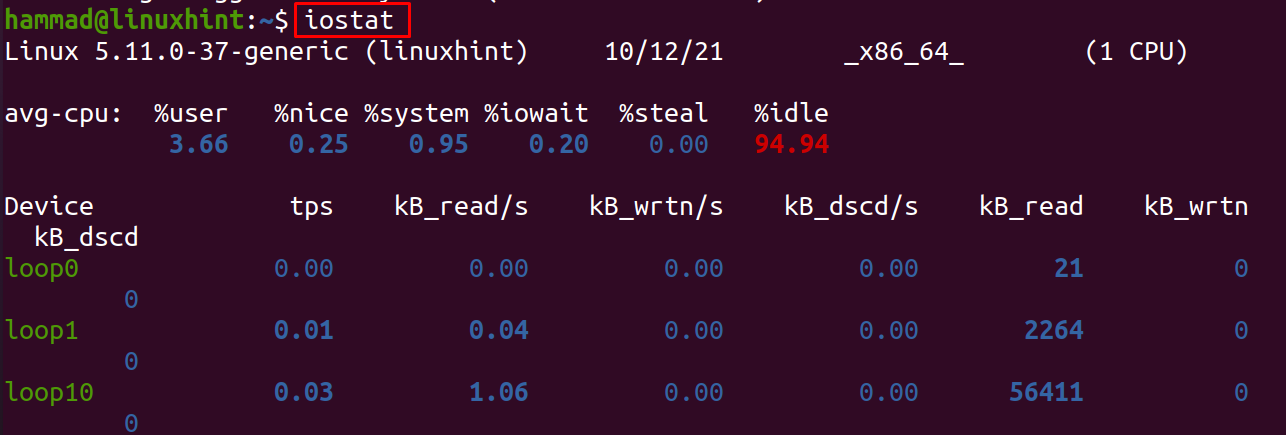
The iostat command is simple and can be executed in the terminal of Linux to display the monitoring report:
In the above output, we can see the report is divided into two parts; CPU utilization report and Devices utilization report.
CPU Utilization Report: The CPU utilization report is displaying the performance of the CPU by different parameters, the explanation to these parameters is:
| Parameter | Explanation |
|---|---|
| %user | The usage of the CPU is display in % |
| %nice | It shows the usage of CPU in percentage at the user level when it is used with the “nice priority” command |
| %system | It shows the usage of CPU in percentage at the system level which is also known as Kernel level |
| %iowait | It is the time (time in %) in which the CPU was inert and the system (Kernel) gets the I/O devices request |
| %steal | It shows the time in percentage in which the virtual CPU involuntarily waited because the hypervisor was serviced by any other processor |
| %idle | It is the time (time in %) in which the CPU was inert and the system (Kernel) gets the no I/O devices request |
Devices utilization report: The devices utilization report displays the performance of the I/O devices on the basis of the following parameters:
| Parameters | Explanation |
|---|---|
| Device | It shows the name of the I/O device whose report is being displayed |
| tps | It shows the transfers per second (tps), where a transfer is a request made by the I/O devices to the CPU and higher the tps means the CPU is busier |
| kB_read/s | It displays the amount of data read by the CPU per second, this can be in different units either in kiloBytes(kB) or megaBytes (MB) depending on the size |
| kB_wrtn/s | It displays the amount of data written by the CPU per second, similar to the kB_read/s, this can be in different units either in kiloBytes(kB) or megaBytes (MB) depending on the size |
| kB_dscd/s | It displays the rate of data discarded by the CPU per second, similar to the kB_read/s, this can be in different units either in kiloBytes(kB) or megaBytes (MB) depending on the size |
| kB_read | It displays the total number of blocks or amount of data read by the CPU |
| kB_wrtn | It displays the total number of blocks or amount of data written by the CPU |
The iostat collects all this data of CPU and the I/O devices from the following directories:
/proc/stat: It contains the details of system statistics
/proc/uptime: The system uptime is extracted from here
/proc/diskstats: The disks statistics are extracted from here
/sys: It contains the statistics for block devices(devices having the fixed size like harddisk)
/proc/self/mountstats: It contains the data for network filesystems
/dev/disk: The persistent device names attached to the system are extracted from here
The general syntax of the iostat command
The general syntax of using the iostat command in Linux is:
To display the summarize report of CPU and I/O devices
If only the “iostat” command is executed, it will display the summarized report of both; CPU and the I/O devices, but it can also be used with different options, which will display the detailed summary of the specific device. For example, if we want to display the CPU utilization report, we will use the “-c” flag with the iostat command:
To display I/O devices report only
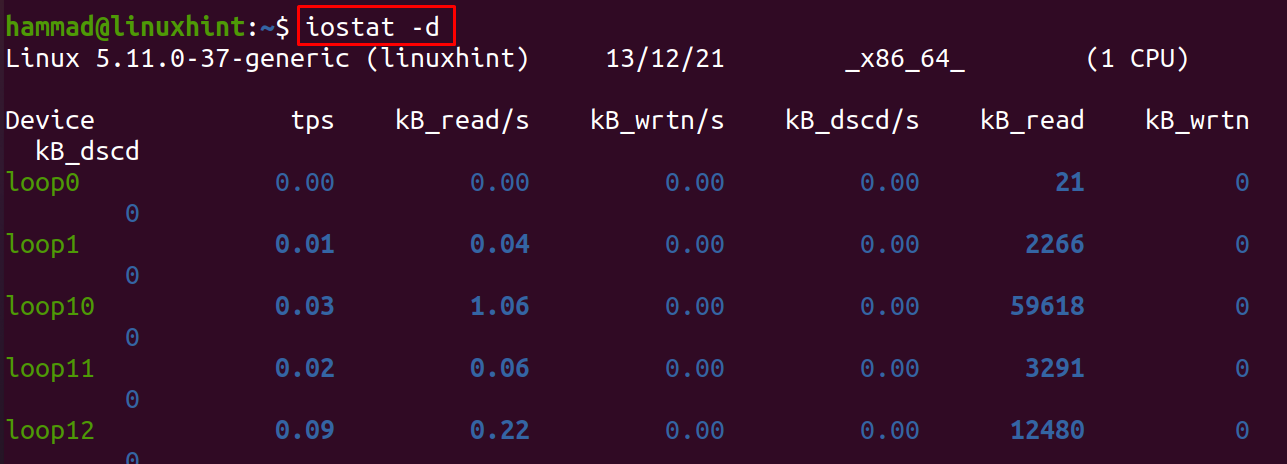
Similarly, we can display only the I/O devices report by using the “-d” flag:
It can be noted from the output, the details of the devices have been displayed.
To display detailed report
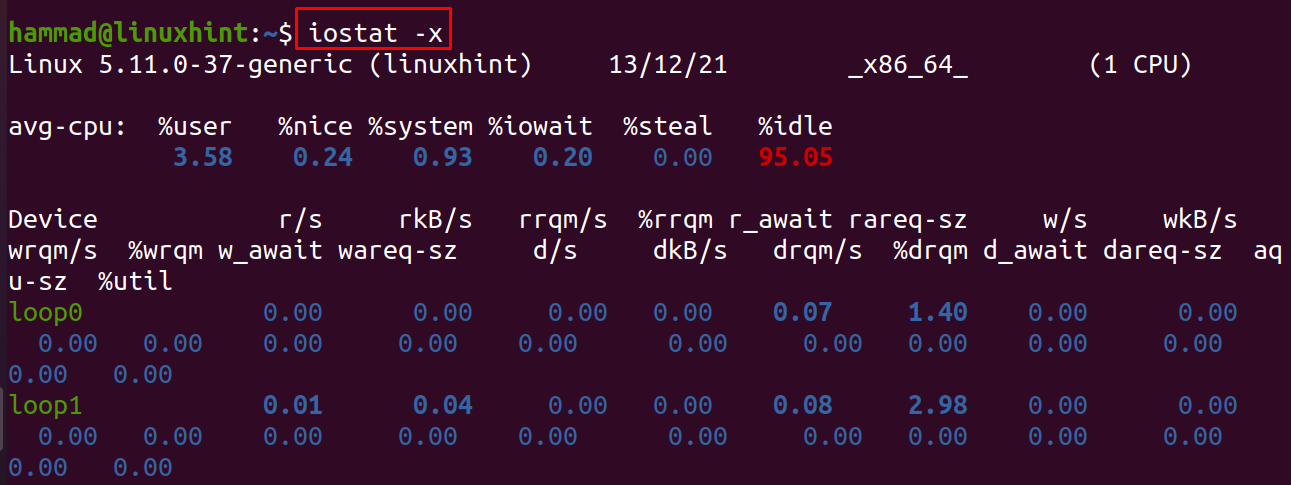
We can use the “-x” flag which is used to display the detailed report:
In the above output, some new parameters are displayed, the explanation of important parameters is mentioned in the table below:
| Parameters | Explanation |
|---|---|
| r/s | The total number of the read requests completed per second |
| rrqm/s | The total number of the read requests merged per second which are queued to the system |
| wrqm/s | The total number of the write requests merged per second which are queued to the system |
| r_await | It is the average time spent by the read requests of the devices from waiting in the queue to the time request accepted by the system |
| w_await | It is the average time spent by the write requests of the devices from waiting in the queue to the time request accepted by the system |
| w/s | The total number of the write requests completed per second |
| %util | The time duration of CPU in which the requests of the I/O devices were submitted |
To display the report using different units
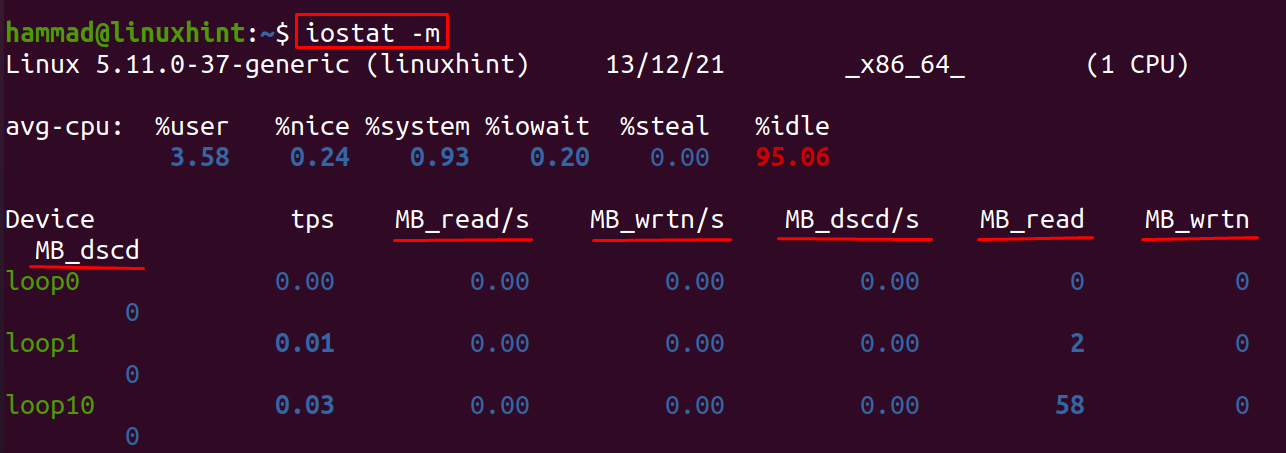
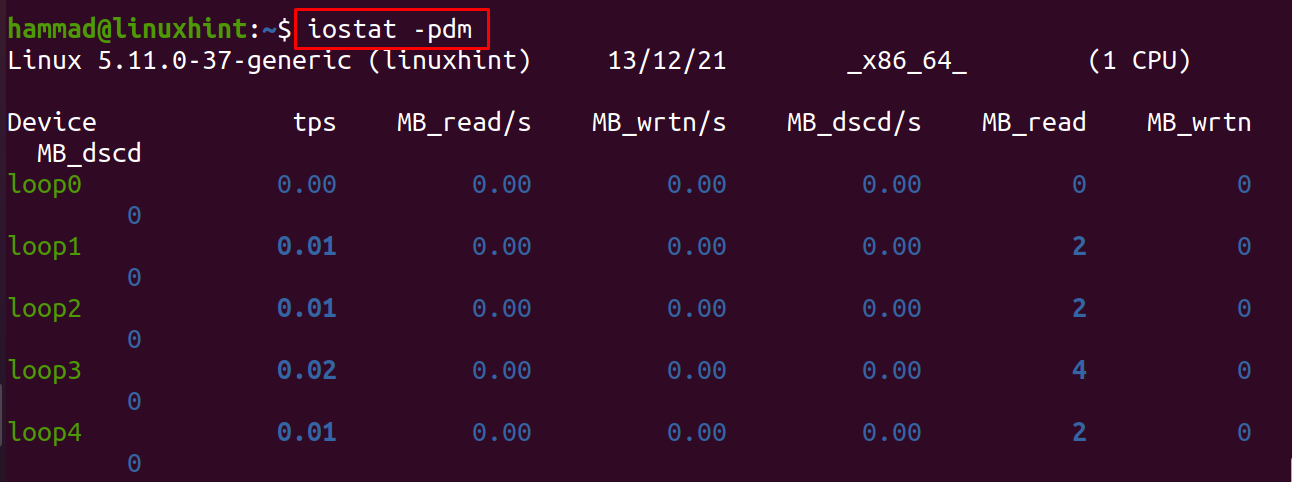
Options “-k” and “-m” are used to display the results in KiloBytes and MegaBytes, to understand it, we will use the “-m” flag to convert our results (which are in kB) into MegaBytes:
To display the report of block devices
To get the monitoring report of the block devices, the “-p” flag is used:
In the above command, we have used three flags “-p”, “-d”, and “-m” altogether to get the details of block devices in megaBytes.
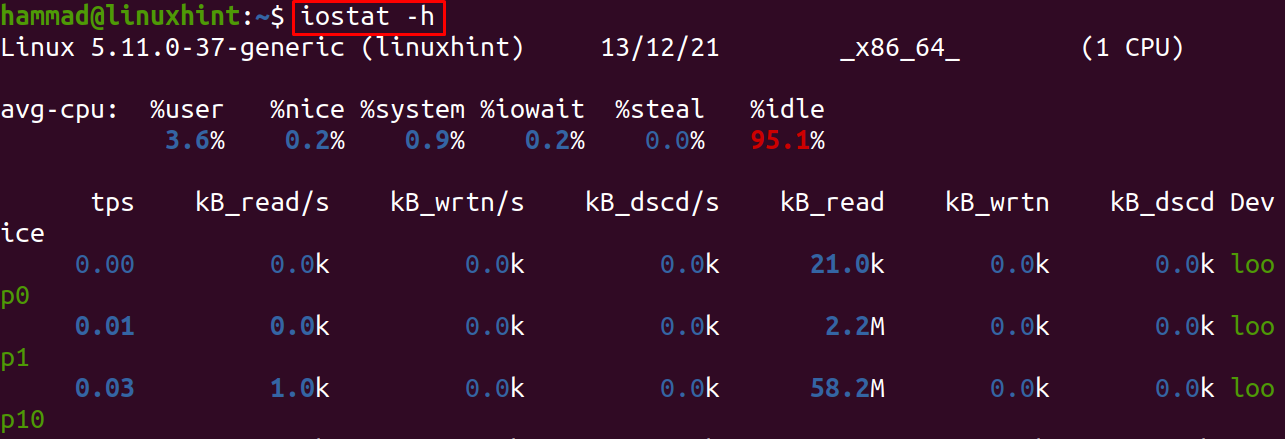
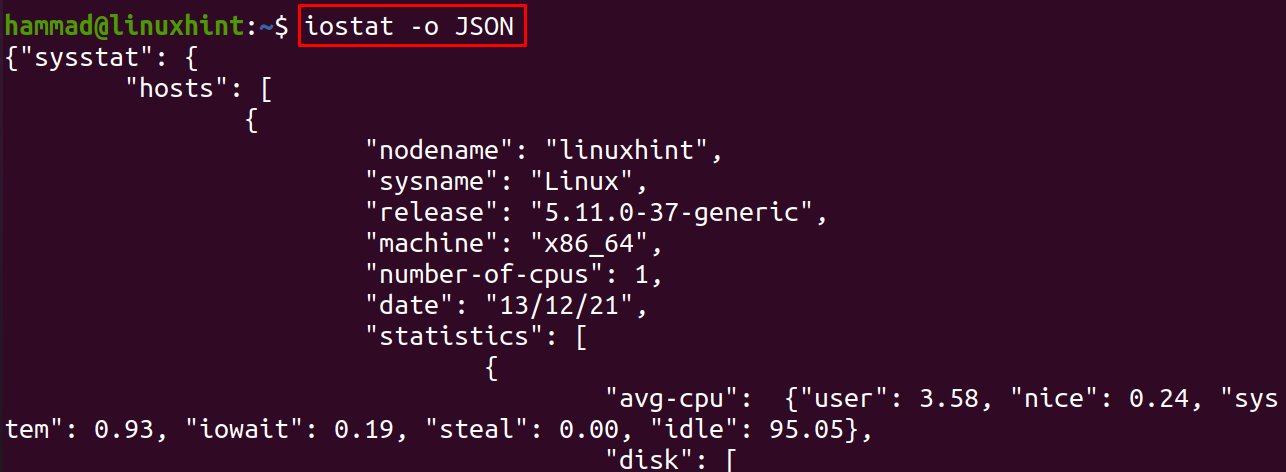
To display report in human-readable and JSON format
We can also display this report in the human-readable format using “-h”:
Or in JSON format using the “-o JSON” option:
Conclusion
The iostat command is used in Linux to monitor the performance of the CPU and the I/O devices, which is useful in distributing the load on different storage devices to get the maximum efficiency from the CPU. In this write-up, we have explained the installation of the iostat command and also the parameters of the report generated by the iostat command. The iostat command can also be used with different flags; the important and most widely used flags are also being discussed.

