If you look at the core man page, it defines as core dump as “a file containing an image of the process’s memory at the time of termination. This image can be used in a debugger (e.g.) gdb to inspect the state of the program at the time that it terminated”.
In simple terms, a core dump file is a file that contains memory information about a process when the specific process terminates.
There are various reasons why processes may crash and create a core dump file. This tutorial will show you how to use GDB to view the core dump file and print the stack trace.
Step 1: Get a Core Dump
Before we start analyzing the core dump file, we need to generate one. To do this, we can use a buggy program.
Consider the code buggy.c below:
In the above code, we create a for loop between 0 and 10. If the value of i is 5, we reference a bad pointer, thereby causing segfault and creating a core dump.
Now run the code as:
The above code will give the output as:
i is 1
i is 2
i is 3
i is 4
Segmentation fault (core dumped)
Step 2: Open Core Dump with GDB
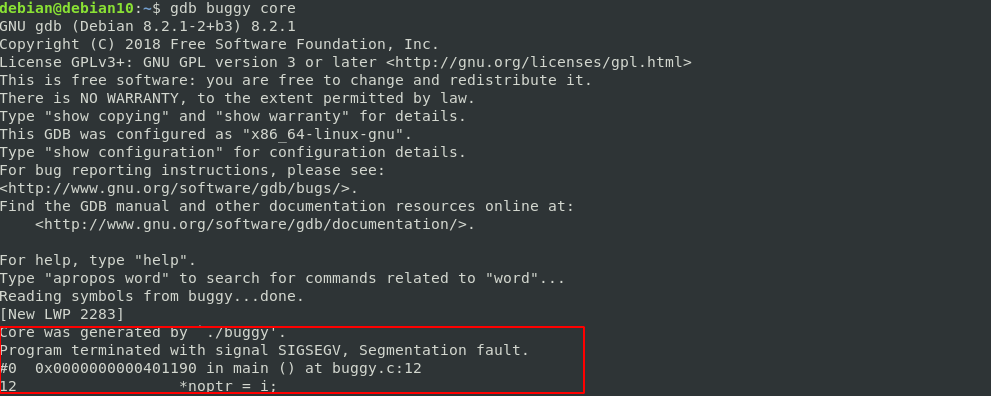
To open the core dump file with GDB, use the gdb command and pass the path to the executable and core dump as parameters as:
This will launch GDB and include the core dump as shown in the output below:
To show the stack trace of the core file, use the backtrace command:
Conclusion
This tutorial showed you how to use GDB to open a core dump file and get the stack trace.

