
The “tcpdump” is a packet analyzer and used to diagnose and analyze network issues. It captures the network traffic going through your device and looks over it. The “tcpdump” tool is a powerful tool to troubleshoot network issues. It comes with many options, which makes it a versatile command-line utility to fix network issues.
This post is a detailed guide about the “tcpdump” utility that includes its installation, common features, and usage with different options. Let’s start with the installation:
How to install “tcpdump”:
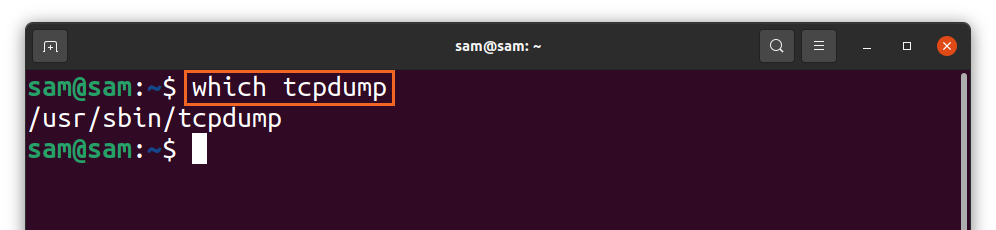
In many distributions, the “tcpdump” comes out of the box, and to check it, use:
If it is not found in your distribution, then install it using:
The above command will be used for Debian-based distributions such as Ubuntu and LinuxMint. For “Redhat” and “CentOS,” use:
How to capture packets with tcpdump:
Various interfaces can be used to capture packets. To get a list of interfaces, use:
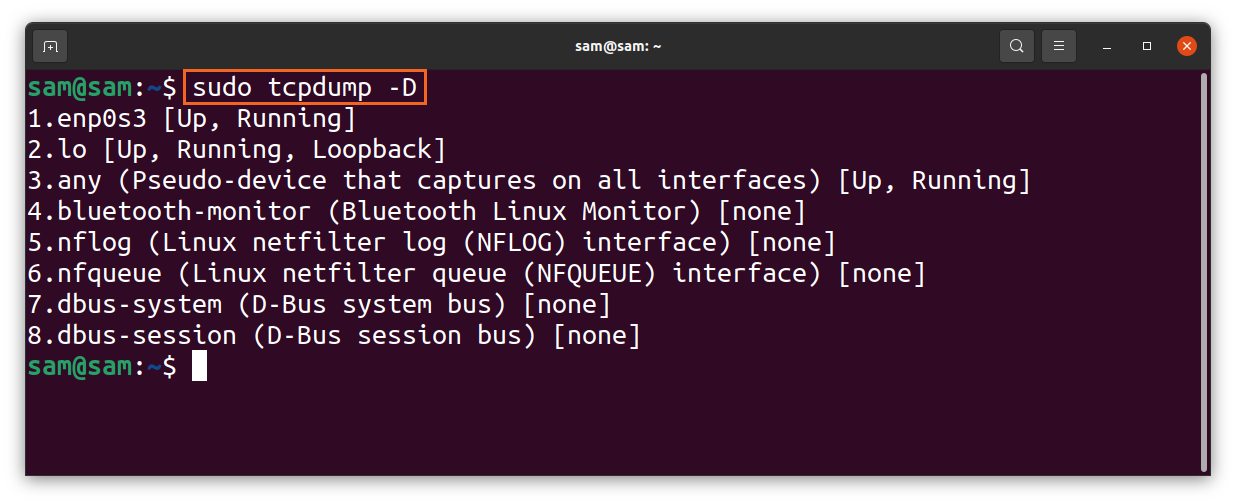
Or simply use “any” with the “tcpdump” command to get packets from the active interface. To begin packet capturing use:

The above command is tracing packets from all the active interfaces. The packets will continuously be grabbed until it gets an interruption from the user (ctrl-c).
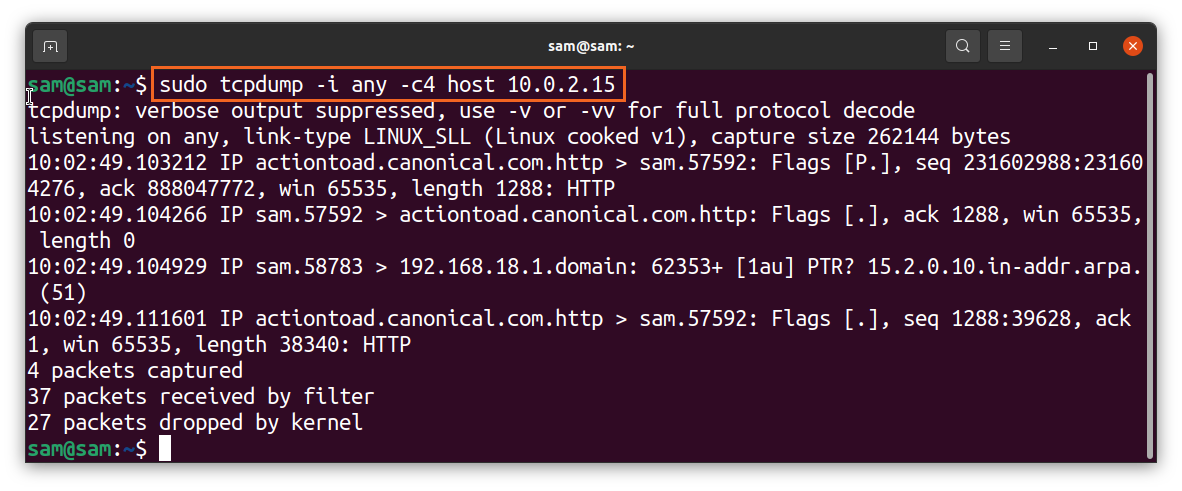
We can also limit the number of packets to be captured using the “-c” flag that signifies the “count.” To capture 3 packets, use:
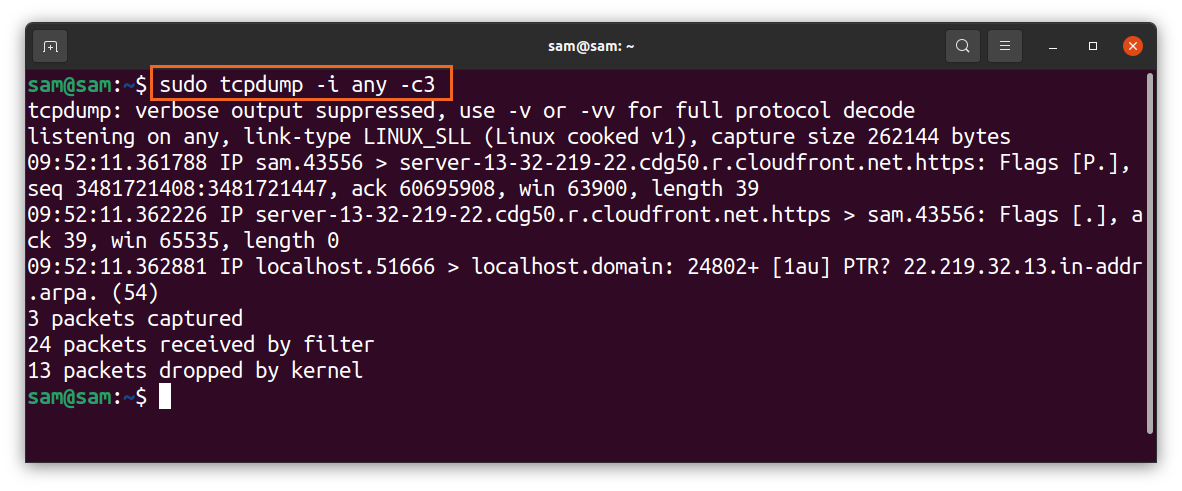
The above command is useful to filter a specific packet. Moreover, troubleshooting the connectivity issues requires only a few initial packets to be captured.
The “tcpdump” command captures packets with IP and port names by default but to clean-up, the mess and make the output easier to understand; the names can be disabled using “-n” and “-nn” for the port option:
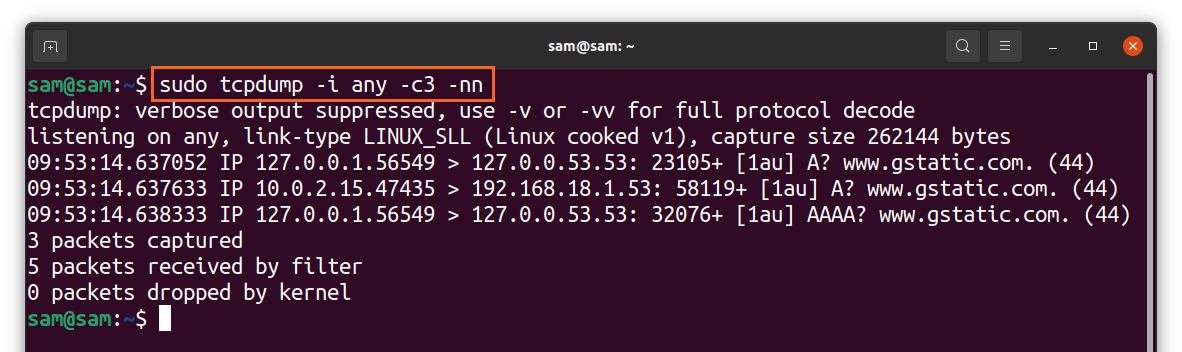
As shown in the above output, the IP and port names have been taken out.
How to understand information about a captured packet:
To learn about the various fields of a captured packet, let’s take an example of a TCP packet:
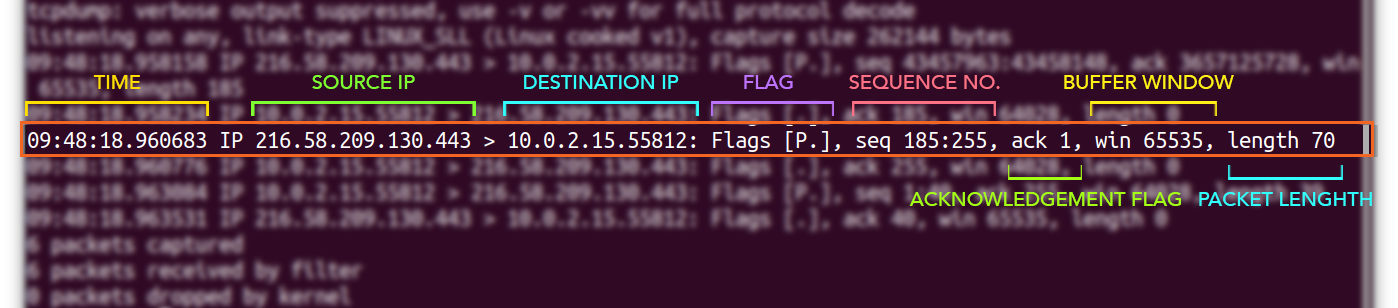
A packet can have various fields, but the general ones are displayed above. The first field, “09:48:18.960683,” represents a time when the packet is received. Next comes IP addresses; the first IP [216.58.209.130] is the source IP and the second IP [10.0.2.15.55812] is the destination IP. Then you will get the flag [P.]; a list of typical flags are given below:
| Flag | Type | Description |
| “.” | ACK | Signifies acknowledgment |
| S | SYN | Flag for starting a connection |
| F | FIN | Flag for a closed connection |
| P | PUSH | Indicates the push of data from the sender |
| R | RST | Connection Reset |

And next comes sequence number “seq 185:255”. The client and server both use the 32-bit sequence number to maintain and monitor data.
The “ack” is a flag; if it is 1, that means the acknowledgment number is valid, and the receiver expects the next byte.
The window number indicates the buffer size. “win 65535” means the amount of data that can be buffered.
And in the end comes the length [70] of the packet in bytes which is a difference of “185:255”.
Filtering packets to fix the network issues:
The “tcpdump” tool captures hundreds of packets, and most of them are of less importance which makes it much complex to get the desired information for troubleshooting. In this case, the filtering will play its role. For instance, while troubleshooting if you are not interested in a particular type of traffic, you can filter it using “tcpdump,” which comes with filtering packets according to the IP addresses, ports, and protocols.
How to capture a packet using hostname with tcpdump command:
To get the packet from a specific host only, use:
If you want to get only one-way traffic, then use “src” and “dst” options in the place of “host.”
How to capture a packet using port number with tcpdump command:
To filter packets with the port number, use:
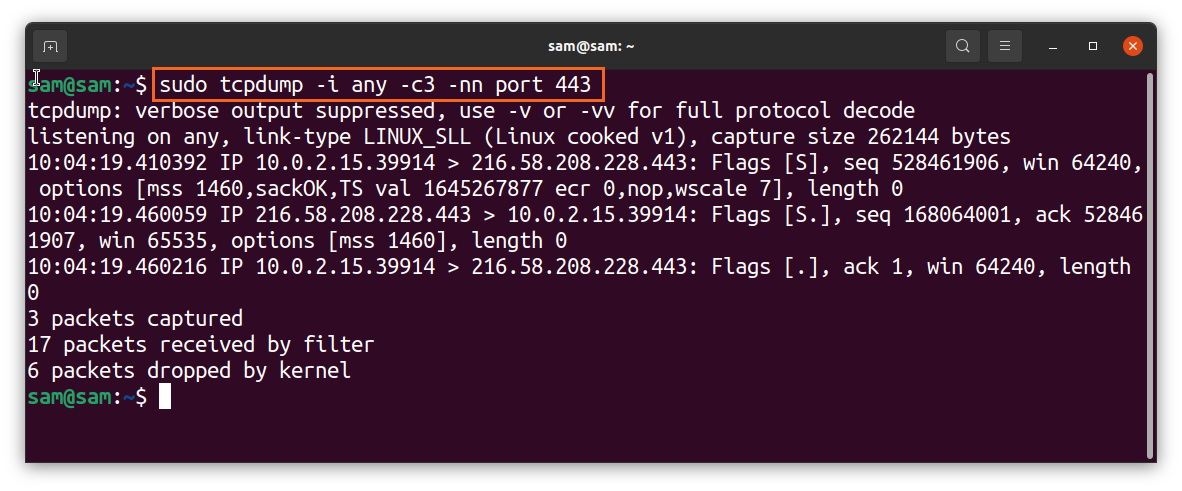
The “443” is the HTTPS port number.
How to capture a packet using the protocol with tcpdump command:
With the “tcpdump” command, you can filter packets according to any protocol such as udp, icmp, arp, etc. Simply type the protocol name:

The above commands will only capture packets that belong to the “udp” protocol.
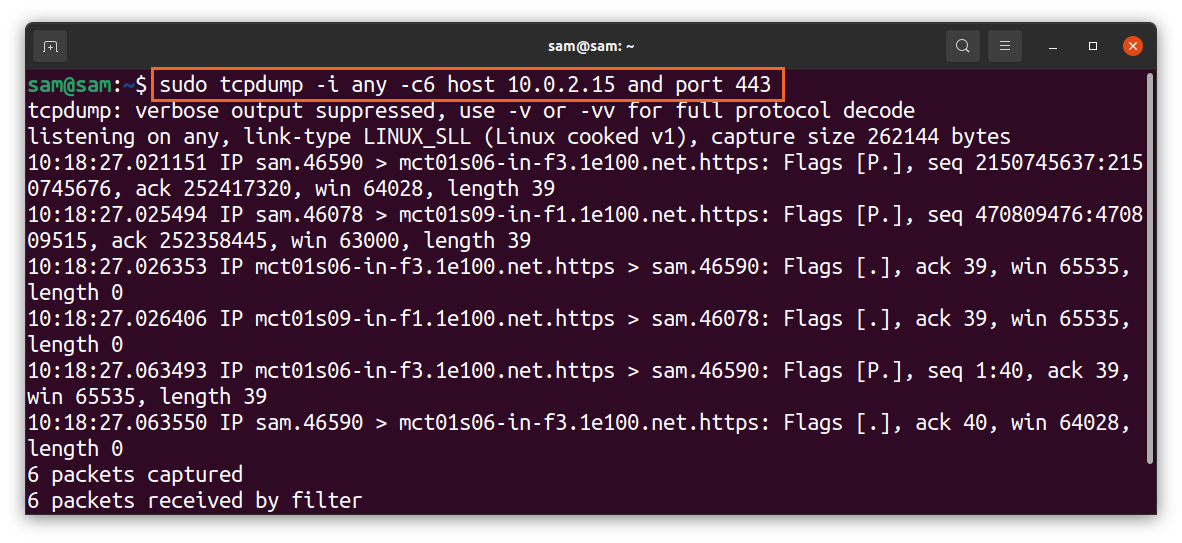
How to combine filtering options using logical operators:
Different filtering options can be combined using logical operators like “and/or”:
How to store captured data:
The grabbed data can be saved to a file to monitor it later, and for that “-w” option will be used, and “w” signifies “write”:
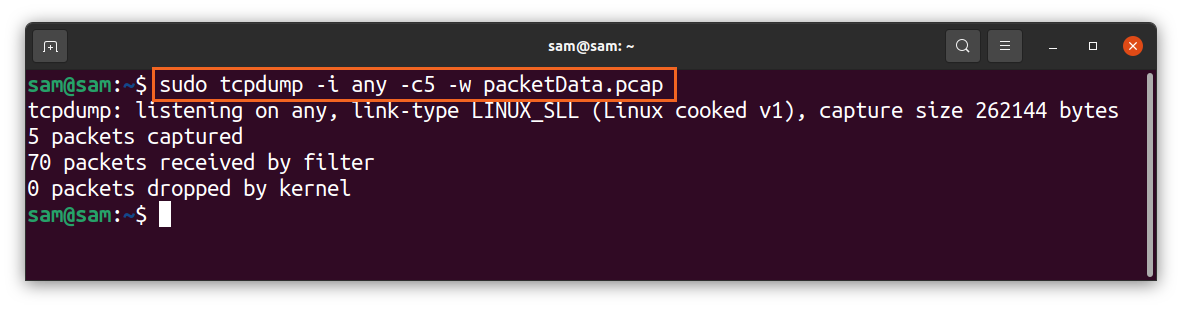
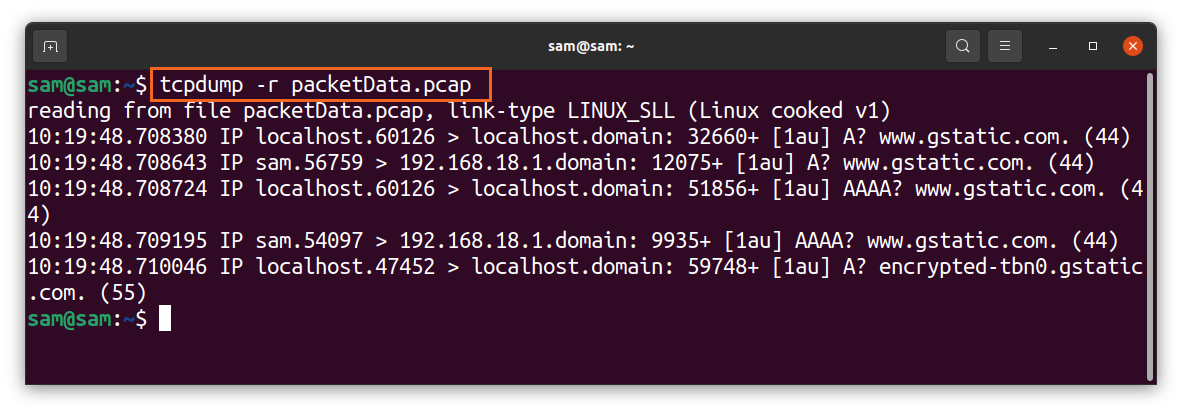
The extension of the file would be “.pcap,” which stands for “packet capture.” Once the capturing is done, the file would be saved in your local drive. This file cannot be opened or read using any text editor program. To read it, use the “-r” flag with “tcpdump”:
Conclusion:
The “tcpdump” is a valuable and flexible tool to capture and analyze network traffic to troubleshoot network problems. This guide’s point of attention is to learn the basic and advanced usage of the “tcpdump” command-line utility. But if you find it difficult, then there is a less complex GUI-based program called “Wireshark,” which does pretty much the same job but with various additional features.