The most important approach to recognizing delays and potential problems within our system is to monitor its resources. The sar package offers the tool sadf through which monitoring resources are possible of our system. In contrast to sar, sadf provides output data in a different format of files, including CSV, XML, and others. By using the sadf, we can easily manage the default format of the pattern processing commands. Additionally, we can use the sadf command to create graphs for the various actions gathered by sar and visualize them in our web browser in the SVG format.
The records and the standard output written in the saved data file can be extracted by utilizing the sadf command. The version of sar that generated this data file must be compatible with sadf. The sadf tool uses the default daily system activity data file if the data file is missing. Furthermore, we can provide -1, -2, etc. as input to the sadf command to show the data from recent days. For instance, the “-1” option will direct the user to the usual system activity file from yesterday. We can use sadf options in the command line to specify which activities need to be reported. To distinguish the flags from those of sadf, add two dashes (–) to the command line before declaring them. Only the CPU activity is chosen when no flags are specified.
Install SAR/sysstat for the sadf Package in Ubuntu 22.04
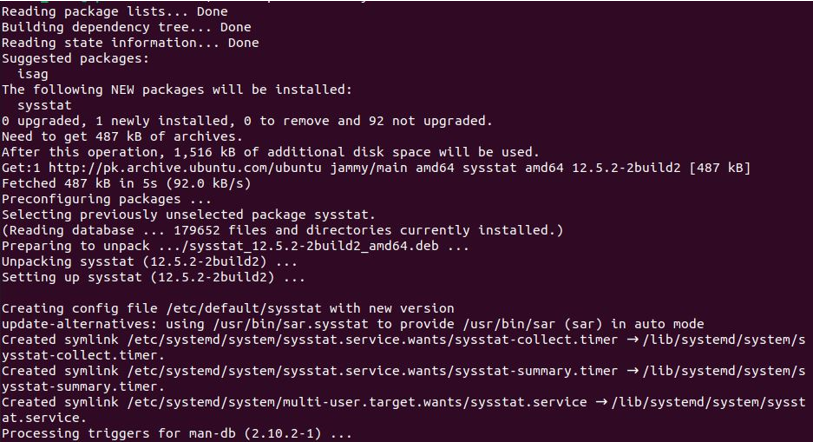
To get the sadf tool in our system, we need to install the sar/sysstat package. The sar package provides many useful tools, which includes the sadf tool. The sar command enables us to monitor the resources of our system, including RAM, CPU, disc I/O, and others, are being utilized. We have accomplished some steps through which the installation of the sar/sysstat package will be easier. First, we have updated the repositories of our system by using the sudo apt command.
After that, the following command is used to install the sar command, which is a component of the sysstat package:
Then, we executed the following command to verify the version of our sar package. Now, we have installed the sar package in our system successfully. So, we can use the sadf command and its option to explore its functionality.
The installation for the sysstat package is completed. To use the sysstat utilities, we have to start the services of the sysstat. For this, we have run the following command:
To enable the sysstat service, we have to use the keyword “enable” to enable the sysstat service in our system.
The cron jobs required will be added and, as a result, permit the collection and processing of system data. The cron jobs are added in the following file, which displays the file’s content upon execution:
Examples of Using the sadf Flags in Ubuntu 22.04 Terminal
Before using the sadf flags, we have ensured that the sadf utility is present in our system. To accomplish this, we have checked the version of the sadf by using the “-V” option, which displays the current version of sadf in our system.
To know which options are available in the sadf command, we have used the “help” flag with the double dash(–). The sadf help command listed all the options and information related to the sadf tool. Now, we know the available options of the sadf command. We are going to use some of the flags with the following sadf command:
Here, we have used the sadf command alone. Running the sadf command showed the results of today’s data.
Now, we have used the flag “-C”, which outputs the activity from a specific day in the current month or earlier of the file “sa21”. The “/var/log/sysstat/” directory includes the data file “sa21” numbered by day for the previous and current months, as shown below:
Next, we have the “–d” flag, which we have used with the sadf command. The “-d” flag prints the data file’s contents so that a relational database system can read them without any issue. The data contain the hostname, interval, timestamp, and other additional CPU fields. Note that semicolons separate each field output here.
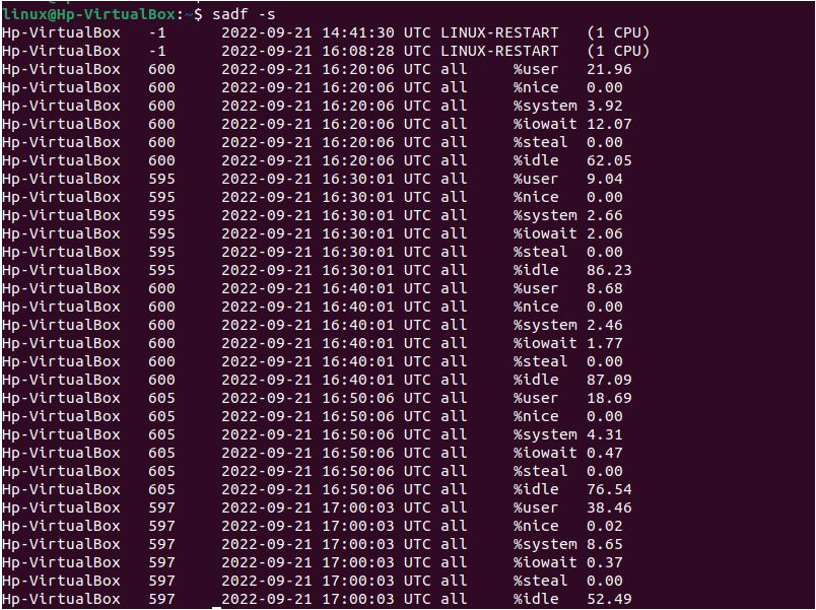
Setting the local time of the data will cause the sadf command to extract records that have been time-tagged at or after the time mentioned. By default, 08:00:00 is the starting time. The 24-hour format is required for hours. To accomplish this, we have the “-s” option, which displays the time in [ hh:mm[:ss] ] format in the time field, as shown below:
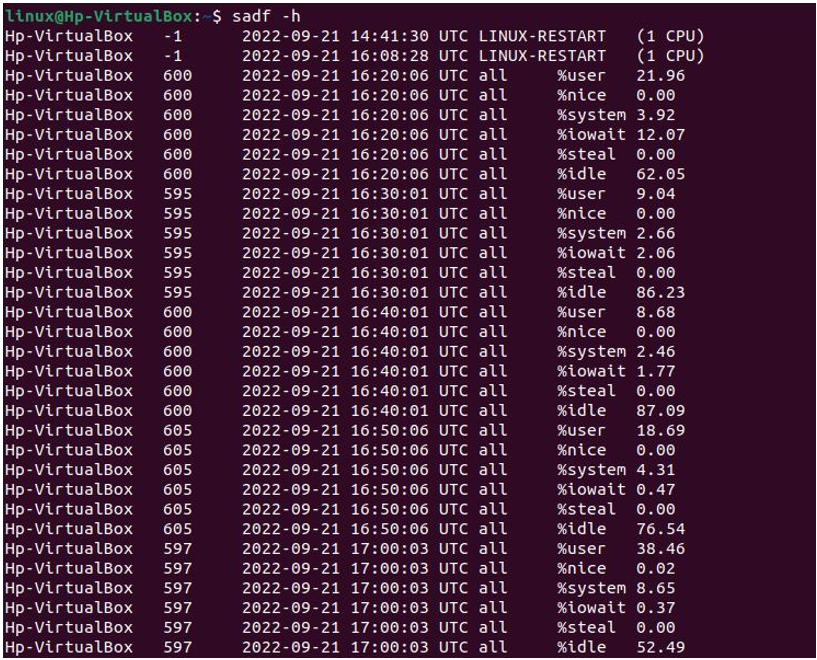
To display all the content activity horizontally, we have to use the sadf –h command in the terminal as displayed in the following terminal screen:
With the “-r” option, we have displayed the unprocessed content of the data files. The data for all the counters are presented using this format as obtained from the kernel. Therefore, no average values over the expired period are calculated.
The upper letter “-P” flag notifies the sadf that only the selected processor(s) should be utilized for processor-dependent statistics reporting. The lowercase “-p” ensures that the data file’s contents should be presented in a format that pattern processing tools handle easily. Here, we have utilized both flags at a time. This will retrieve the processor 1 of the CPU statistics from the current daily data file and provide them in a way that pattern processing commands can easily understand.
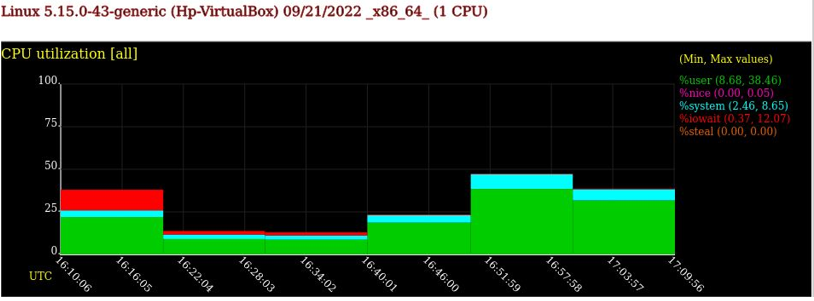
One of the greatest features of more recent iterations of sysstat is the way to create the Scalable Vector Graphics (SVG). For this, we have to use the “-g” flag to transform the content of the data file into a graph in SVG format. We have to use the following syntax to view the graph in the SVG format.
By selecting this option, we have used the web browser to view the attractive graph of our activity on the system.
Conclusion
The main purpose of the sadf command in Linux is to display many formats of the data the sar collected. To get the sadf tool in our Linux system, we must install the sar or sysstat package. We have exhibited the technique to install the sar package, which provides the sadf command. After the installation, we can use the sadf command in our terminal to view the activity of our resources. We have used various flags with the sadf command, which displayed the activity of the sar data.


