This guide will discuss configuring and using the Redis slow log commands.
What is Redis Slow Log?
The Redis Slow Log or RSL is a feature that allows the Redis server to track and log all queries that exceed the allocated execution time.
If you are experiencing slow query execution or high CPU usage in your Redis server, this is the tool you want to use.
NOTE: The execution time allocated does not include Input/Output operations. It refers to the actual time after the server receives the command and its time to complete executing it.
How Slow Log Works?
The slow log feature is very simple. It works into two simple steps.
- Once a query is issued, the server keeps track of the time elapsed when executing the command.
- If the command exceeds the allocated time, it is logged using the slow log system.
NOTE: The execution time of a query is specified in the slowlog-log-slower-than directive in the Redis configuration file.
You can also specify the number of entries in the slow log file using the slowlog-max-len directive.
Setting up Log Parameters
Two entries allow you to configure slow log parameters.
- Slowlog-log-slower-than
- Slowlog-max-len
Edit the configuration file with your text editor to change or set these values. By default, these values are set to:
slowlog-max-len 128
Hence, the server will log 128 entries of the queries that exceed 10000 microseconds.
If the log entry contains more than the specified entries, it removes the oldest one to make space for a new entry.
Using the config set command, you can also configure the slowlog parameters at runtime. An example is as shown:
127.0.0.1:6379> config set slowlog-max-len 128
Redis Slow Log
Before reading the entries in the slowlog, let us change the value of the slowlog to a very small value.
An example command is as shown below:
OK
All queries that exceed 1 microsecond will be logged into the entries.
Let us perform sample queries as shown:
(integer) 2
127.0.0.1:6379> HGETALL user_info
In the above example, we run two queries that are bound to exceed 1 micro second.
Fetching Slow Log Entries
To fetch all the entries in the Redis Slow log, run the SLOWLOG GET command:
The command above should retrieve all the entries as shown in the output below:
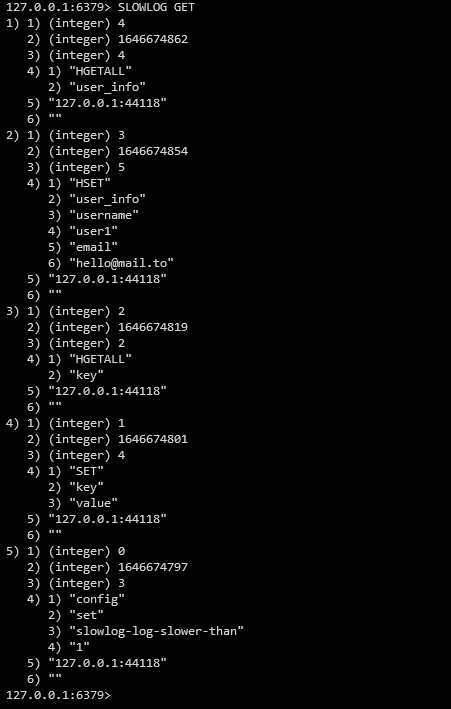
Components of a Slow Log Entry
Each Slow Log entry is comprised of 6 main parts.
- The first is a unique identifier for the log entry.
- Next is a unix timestamp denoting the time at which the entry was added.
- The third part denotes the time that the query took in microseconds.
- Fourth is an array containing the arguments of the specified command.
- Last but not least is the client address and port that issued the command.
- Finally, the client name as specified by the client setname command.
Redis Reset Slow Log Entries
If you want to clean up the slow log entries, use the SLOWLOG RESET command as shown:
OK
The command should remove all existing entries. However, if the reset command exceeds the specified time, it will be added to the logs.
Conclusion
This article covered one of the best tools for administering and troubleshooting Redis; Redis Slow Log.
See you in the next one!