Transforming the Pyspark DataFrame from one column to multiple columns in the Hadoop Ecosystem is necessary. In PySpark DataFrame, if you want to pivot a column with an aggregation, the method is known as “pivoting”. To achieve this functionality, PySpark supports the pivot() function which is available in pyspark.sql.GroupedData. In this guide, we will discuss the pivot() function in detail by considering different parameters with examples.
Topic of Contents:
-
- PySpark Pivot() with All Column Values
- PySpark Pivot() with Specific Column Values
If you want to know about PySpark DataFrame and module installation, go through this article.
Pyspark.sql.GroupedData.pivot()
In PySpark DataFrame, if you want to pivot a column with an aggregation, the method is known as “pivoting”. Pivot() is used to group the column values to individual unique column values. If the values don’t exist for a particular grouped data, null is returned in the transformed DataFrame. It is important to group the values in a particular column before performing the pivot on any column. After that, we can perform any aggregation operation like sum(), min(), mean(), max(), etc. We can implement all the following three instances within a single line of code:
-
- Group the values of a column using groupby()
- Pivot a column using pivot()
- Apply the aggregation on other column using the aggregate function
Syntax:
Let’s see the syntax of pivot():
Parameters:
-
- The first parameter is necessary which takes the column name. Pivot is done on this column only.
- The second parameter is optional which takes a list of column values that are available in the pivoting column. It only pivots the specified columns. If you want all values as columns, there is no need to specify the column names.
Data:
In this entire guide, we will use only one PySpark DataFrame for demonstration. Make sure that you first create this DataFrame (with 6 columns and 10 rows) in your environment after the installation of PySpark.
from pyspark.sql import SparkSession,Row
linuxhint_spark_app = SparkSession.builder.appName('Linux Hint').getOrCreate()
# create the dataframe that store Farming details
farming_df = linuxhint_spark_app.createDataFrame([Row(Area='Urban',Land='Poor',Soil='Black',
Field_count=100,Crop_Name='Paddy',Quantity=34000),
Row(Area='Urban',Land='Rich',Soil='Red',Field_count=20,Crop_Name='Wheat',
Quantity=200000),
Row(Area='Rural',Land='Poor',Soil='Red',Field_count=200,Crop_Name='Paddy',
Quantity=24000),
Row(Area='Rural',Land='Poor',Soil='Black',Field_count=400,Crop_Name='Paddy',
Quantity=24000),
Row(Area='Urban',Land='Poor',Soil='Red',Field_count=1000,Crop_Name='Maize',
Quantity=35000),
Row(Area='Urban',Land='Poor',Soil='Red',Field_count=200,Crop_Name='Corn',
Quantity=45000),
Row(Area='Rural',Land='Rich',Soil='Black',Field_count=150,Crop_Name='Potato',
Quantity=1200),
Row(Area='Urban',Land='Rich',Soil='Black',Field_count=70,Crop_Name='Chillies',
Quantity=13000),
Row(Area='Rural',Land='Rich',Soil='Sand',Field_count=50,Crop_Name='Paddy',
Quantity=0),
Row(Area='Rural',Land='Poor',Soil='Sand',Field_count=90,Crop_Name='Paddy',
Quantity=12000),
])
farming_df.show()
Output
PySpark Pivot() with All Column Values
In this scenario, we create some user-defined functions with pandas_udf() and apply them on columns and display the results using the select() method. In each case, we use the pandas.Series as we perform the vectorized operations. This considers the column values as a one-dimensional array and the operation is applied on the column. We specify the return type function in the decorator itself.
Example 1: Pivot() with the Sum() Aggregation
-
- Find the total “Field_count” (sum) for each “Area” by “Land” with each “Land” as a separate column.
- Find the total “Quantity” (sum) for each “Area” by “Land” with each “Land” as a separate column.
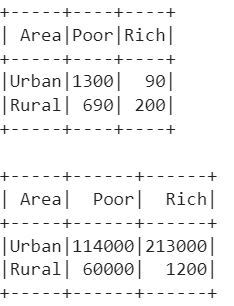
farming_df.groupBy("Area").pivot("Land").sum("Field_count").show()
# Groupby Area, Pivot by Land and return total Quantity.
farming_df.groupBy("Area").pivot("Land").sum("Quantity").show()
Output:
Explanation:
- 1. There are only two groups in the “Area” column – “Urban” and “Rural”. The values in the land column are “Poor” and “Rich”. So, “Poor” and “Rich” are transformed to columns in the pivoted DataFrame.
- The “Urban” fields available for “Poor” are 1300.
- The “Urban” fields available for “Rich” are 90.
- The “Rural” fields available for “Poor” are 690.
- The “Rural” fields available for “Rich” are 200.
- 2. Similarly, the same transformation is done on the “Land” column, but we aggregate on the “Quantity” column.
- The “Urban” quantity for “Poor” is 114000.
- The “Urban” quantity for “Rich” is 213000.
- The “Rural” quantity for “Poor” is 60000.
- The “Rural” quantity for “Rich” is 1200.
Example 2: Pivot() with the Min() & Max() Aggregation
-
- Find the minimum number of fields in each “Area” by “Crop_Name” with each crop from the “Crop_Name” as a separate column.
- Find the maximum number of fields in each “Area” by “Crop_Name” with each crop from the “Crop_Name” as a separate column.
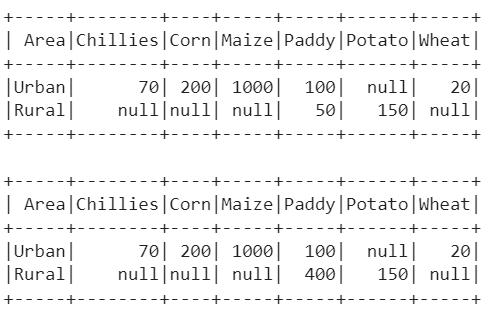
farming_df.groupBy("Area").pivot("Crop_Name").min("Field_count").show()
# Groupby Area, Pivot by Crop_Name and return maximum of fields.
farming_df.groupBy("Area").pivot("Crop_Name").max("Field_count").show()
Output:
Explanation:
- 1. There are only two groups in the “Area” column – “Urban” and “Rural”. The values in the “Crop_Name” column are “Chillies”, “Corn”, “Maize”, “Paddy”, “Potato” and “Wheat”. These 6 crops are transformed to columns in the pivoted DataFrame.
- The minimum fields for “Chillies” of the “Urban” area is 70, for “Corn” of the “Urban” area is 200, for “Maize” of the “Urban” area is 1000, for “Paddy” of the “Urban” area is 100, and for “Wheat” of the “Urban” area is 20. There is no field for “Potato” with the “Urban” area.
- There is no field for “Chillies”, “Corn”, “Maize”, and “Wheat” with the “Rural” area. The minimum fields for “Paddy” of the “Rural” area is 50 and for “Potato” of the “Rural” area is 150.
- 2. There are only two groups in the “Area” column – “Urban” and “Rural”. The values in the “Crop_Name” column are “Chillies”, “Corn”, “Maize”, “Paddy”, “Potato” and “Wheat”. These 6 crops are transformed to columns in the pivoted DataFrame.
- The maximum fields for “Chillies” of the “Urban” area is 70, for “Corn” of the “Urban” area is 200, for “Maize” of the “Urban” area is 1000, for “Paddy” of the “Urban” area is 100, and for “Wheat” of the “Urban” area is 20. There is no field for “Potato” with the “Urban” area.
- There is no field for “Chillies”, “Corn”, “Maize”, and “Wheat” with the “Rural” area. The maximum fields for “Paddy” of the “Rural” area is 400 and for “Potato” of the “Rural” area is 150.
Example 3: Pivot() with Specific Column Values
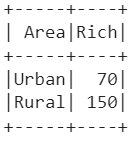
Find the maximum number of fields in each “Area” by “Land” with only the “Rich” from the “Land” as a separate column.
farming_df.groupBy("Area").pivot("Land", ["Rich"]).max("Field_count").show()
Output:
We can see that the “Rich” from the “Area” column is transformed as a separate column and the maximum number of fields is returned.
Conclusion
We learned how to transform the Pyspark DataFrame from one column to multiple columns using the pivot() function. If the values don’t exist for a particular grouped data, null is returned in the transformed DataFrame. We demonstrated the different examples with different aggregate functions that are applied on the pivoted DataFrame. It is possible to transform the PySpark DataFrame with specific values in a column by passing the values in a list as a second parameter to the pivot() function.


