In this guide, we will first see the approach and then predict the stroke of each person by analyzing the data step by step.
Logistic Regression
Logistic regression, also called the “Logit Model”, is used in predictive analytics for classification problems. This is a Machine Learning model which works only on classification to classify the classes (categories). For example, there are two categories in our scenario (a person who is affected with stroke and a person who is not affected with stroke). The best applications of the model are heart disease prediction, gender prediction, crop life prediction, etc.
Steps:
1. Data Collection: The data is necessary to perform any predictions/analysis. It can be in the form of CSV/XLSX, among others. We can load this into the Spark environment (DataFrame) using the spark.read.csv() method.
2. Data Analysis: Analyzing the attributes/columns is known as “data analysis”. The columns which help to predict the class are known as “independent attributes”. The column which results in prediction is known as “dependent or target attribute”. In this scenario, we can use the columns property to display all the columns. The distinct() method is used to see the unique values.
3. Data Preprocessing: Filtering the null/missing values is known as “preprocessing”. We remove all the missing values in this stage. The machine only knows the binary language. So, all the string categories should be converted to numeric categorical values. In PySpark, we can use the “StringIndexer” which is the available class in the pyspark.ml.feature module to convert the string categories to numeric. It automatically converts them internally. We need not to provide the values. You can use the following syntax:
4. Vector Assembling: Now, you have the data that the machine can understand. In this stage, all the independent attributes should be vectorized into a single column. This can be done using the VectorAssembler class. It takes two parameters: The first parameter is the inputCols which takes a list of independent attributes. The second parameter is the outputCol which vectorizes all the inputCols into this variable.
5. Transformation: Now, prepare your data by transforming the updated columns (Step 3) using the transform() function.
6. Preparing the Data for Training & Testing: In this stage, we split the data into “training” and “testing”. It will be better if we split the 70% data to train the model and 30% data to test the model. This can be achieved using the randomSplit() method. It takes a list which holds two float values: one for test split and another for train split.
7. Model Fitting & Evaluation: It’s time to fit the Logistic Regression model. The Logistic Regression model is available in the pyspark.ml.classification module. It takes the class label/target column. This results in rawPrediction, probability, and prediction columns. Our results are stored in the prediction column.
logistic_regression_model=LogisticRegression(labelCol=target_column).fit(train_data)
# Model evaluation
train_results=logistic_regression_model.evaluate(train_data).predictions
8. Accuracy & Results: This is the final stage where we test the model accuracy using any testing techniques.
Let’s look at the following project where we predict whether a person is affected by stroke or not using the Logistic Regression model.
Stroke Prediction
9. Install the PySpark module in your environment. The following is the command to install:

10. Let’s create a PySpark DataFrame with 10 records which are related to stroke details of 10 persons. For demonstration, we create a DataFrame without CSV. There are 7 columns in this DataFrame. “Gender”, “Glucose_level”, “married”, “age”, “heart_disease”, “hyper_tension” are independent attributes and “Stroke” is the class label or dependent attribute. That means that the stroke of a person is dependent on these independent attributes.
from pyspark.sql import SparkSession
linuxhint_spark_app = SparkSession.builder.appName('Linux Hint').getOrCreate()
stoke_data =[
{'Gender':'Female','age':50,'heart_disease':'Yes',
'hyper_tension':'Yes','married':'Yes','Glucose_level':130,'Stroke':1},
{'Gender':'Male','age':20,'heart_disease':'No',
'hyper_tension':'Yes','married':'No','Glucose_level':97,'Stroke':0},
{'Gender':'Male','age':12,'heart_disease':'No',
'hyper_tension':'No','married':'No','Glucose_level':98,'Stroke':0},
{'Gender':'Female','age':90,'heart_disease':'No',
'hyper_tension':'No','married':'Yes','Glucose_level':170,'Stroke':1},
{'Gender':'Male','age':43,'heart_disease':'Yes',
'hyper_tension':'Yes','married':'Yes','Glucose_level':150,'Stroke':1},
{'Gender':'Female','age':21,'heart_disease':'No',
'hyper_tension':'No','married':'Yes','Glucose_level':110,'Stroke':0},
{'Gender':'Female','age':50,'heart_disease':'Yes',
'hyper_tension':'No','married':'Yes','Glucose_level':100,'Stroke':0},
{'Gender':'Male','age':34,'heart_disease':'No',
'hyper_tension':'Yes','married':'Yes','Glucose_level':190,'Stroke':1},
{'Gender':'Male','age':10,'heart_disease':'No',
'hyper_tension':'No','married':'No','Glucose_level':90,'Stroke':0},
{'Gender':'Female','age':56,'heart_disease':'Yes',
'hyper_tension':'Yes','married':'Yes','Glucose_level':145,'Stroke':1}
]
# create the dataframe from the above data
stroke_df = linuxhint_spark_app.createDataFrame(stoke_data)
# Actual stoke_df
stroke_df.show()
Output:

11. Display the independent columns using the select() method.
stroke_df.select(stroke_df["Gender"],stroke_df["Glucose_level"],stroke_df["married"],stroke_df["age"],stroke_df["heart_disease"],stroke_df["hyper_tension"]).show()
Output:

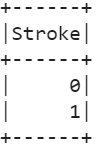
12. Display the unique values that are present in the target attribute (Stroke).
stroke_df.select(stroke_df["Stroke"]).distinct().show()
Output:
13. Return the data type of all the columns using the printSchema() function.
stroke_df.printSchema()
Output:
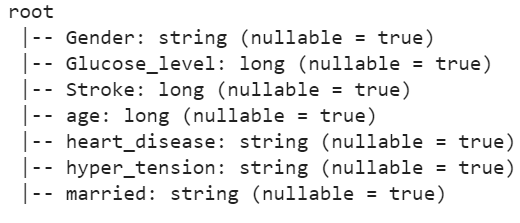
We can see that 4 columns are of string type. Let’s convert them into categorical numeric values.
14. Let’s convert the string categorical values to numeric categorical values using the StringIndexer in the “Gender”, “heart_disease”, “hyper_tension”, and “married” columns and write these into the Categotical_Gender, Categotical_heart_disease, Categotical_hyper_tension, and Categotical_married columns. Store the columns into the indexed_data DataFrame using the fit() method.
# Convert string categorical values to numeric categorical values in the "Gender" column.
indexer_data=StringIndexer(inputCol= "Gender",outputCol='Categotical_Gender')
indexed_data=indexer_data.fit(stroke_df).transform(stroke_df)
# Convert string categorical values to numeric categorical values in the "heart_disease" column.
indexer_data=StringIndexer(inputCol= "heart_disease",outputCol='Categotical_heart_disease')
indexed_data=indexer_data.fit(indexed_data).transform(indexed_data)
# Convert string categorical values to numeric categorical values in the "hyper_tension" column.
indexer_data=StringIndexer(inputCol= "hyper_tension",outputCol='Categotical_hyper_tension')
indexed_data=indexer_data.fit(indexed_data).transform(indexed_data)
# Convert string categorical values to numeric categorical values in the "married" column.
indexer_data=StringIndexer(inputCol= "married",outputCol='Categotical_married')
indexed_data=indexer_data.fit(indexed_data).transform(indexed_data)
# Display the updated
indexed_data.show()
Output:

15. Convert the independent columns into a vector using the vector assembler. The vector name is “features”.
assembler= VectorAssembler(inputCols=['Categotical_Gender','Categotical_heart_disease','Categotical_hyper_tension','Categotical_married','age',
'Glucose_level'],outputCol='features')
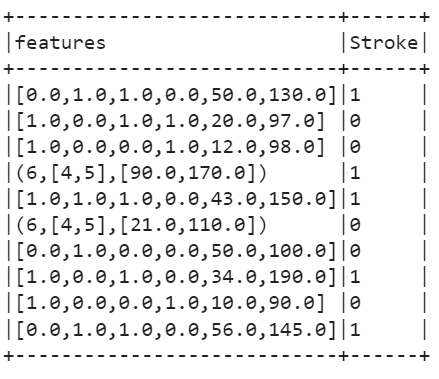
16. Transform the previous data into a final DataFrame using the transform() function and display it using the show() function.
Output:
17. Prepare the data for training and testing by splitting it into 70-30. The “features” is stored in the train_data and “Stroke” is stored in the test_data.
train_data,test_data=final.select(['features','Stroke']).randomSplit([0.70,0.30])
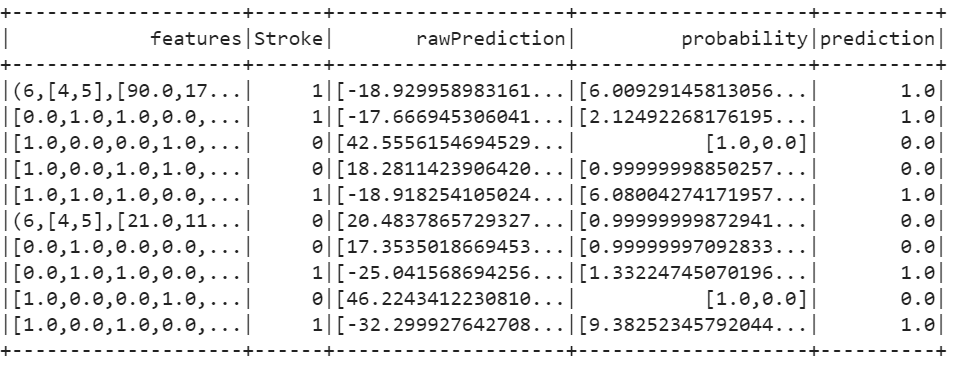
18. Fit the Logistic Regression model and evaluate it.
# Model fitting
logistic_regression_model=LogisticRegression(labelCol='Stroke').fit(train_data)
# Model evaluation
train_results=logistic_regression_model.evaluate(train_data).predictions
train_results.show()
Output:
19. Use the BinaryClassificationEvaluator to check the model accuracy. We can see that our model is 100% accurate.
# call the BinaryClassificationEvaluator
results = BinaryClassificationEvaluator(rawPredictionCol='prediction',labelCol='Stroke')
ROC_AUC = results.evaluate(train_results)
print(ROC_AUC * 100 , '% Accuracy')
Conclusion
You are able to predict the real-tile classification problem using the Logistic Regression model in PySpark. Removing the null/missing values are important as they decrease the model evaluation and accuracy. Preprocessing is a necessary step before fitting any machine learning model. Make sure that you do this step properly and accurately.