In this guide, we will see how to plot the PySpark Data on histogram. We can see two scenarios here. Histogram is created on PySpark Pandas DataFrame and on RDD data. For these two scenarios, PySpark provides two functions: pyspark.pandas.DataFrame.plot.hist() & pyspark.RDD.histogram.
Topic of Contents:
- Plot Histogram on the PySpark Pandas DataFrame
- Plot Histogram on the PySpark Pandas DataFrame with the Bins Parameter
- Plot Histogram on the PySpark RDD by Specifying the Bucket Number
- Plot Histogram on the PySpark RDD by Specifying the Size of Each Bucket
Pyspark.pandas.DataFrame.plot.hist()
In this scenario, histogram is displayed as a graph-like representation of data that buckets a range of classes into columns (from the PySpark Pandas DataFrame) along with the horizontal x-axis. The y-axis represents the number count of occurrences in the PySpark Pandas DataFrame for each column.
Syntax:
It takes the total number of bins as an optional parameter which is an integer and some optional keyword arguments. If the bins are not specified for each column, a bar is created.
Plot Histogram on the PySpark Pandas DataFrame
Create a PySpark Pandas DataFrame having 2 columns with 4 records. Plot the histogram without passing any parameter to the plot.hist() function.
pyspark_pandas_dataframe=pandas.DataFrame({'Building_height':[120.56,234.67,12.0,200.45],'Building_Area':[2,3,1,4]})
print(pyspark_pandas_dataframe)
# PySpark-Pandas histogram
pyspark_pandas_dataframe.plot.hist()
Output:
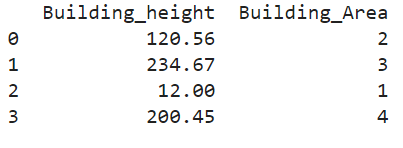
Here, the column names are “Building_height” and “Building_Area”.
Let’s look at the Histogram:
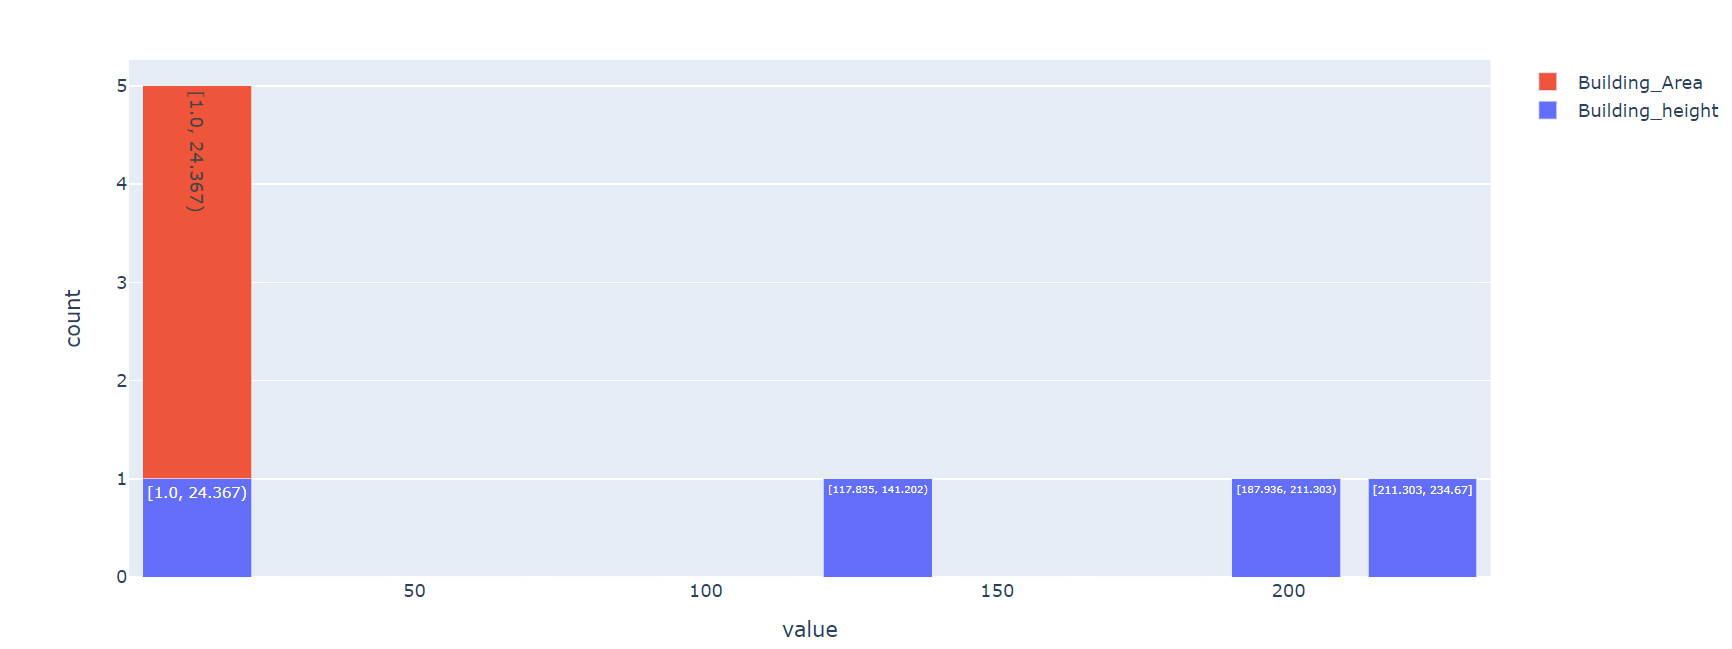
The total number of rows in the previous DataFrame is 4. So, 4 bins are created.
Plot Histogram on the PySpark Pandas DataFrame with the Bins Parameter
Create a PySpark Pandas DataFrame having 2 columns with 4 records. Plot the histogram without passing any parameter to the plot.hist() function.
pyspark_pandas_dataframe=pandas.DataFrame({'Building_height':[120.56,234.67,12.0,200.45],'Building_Area':[2,3,1,4]})
# PySpark-Pandas histogram with 2 bins
pyspark_pandas_dataframe.plot.hist(bins=2)
Output:
Here, the column names are “Building_height” and “Building_Area”.
Let’s look at the histogram – red refers to “Building_Area” and blue refers to the “Building_height” column:
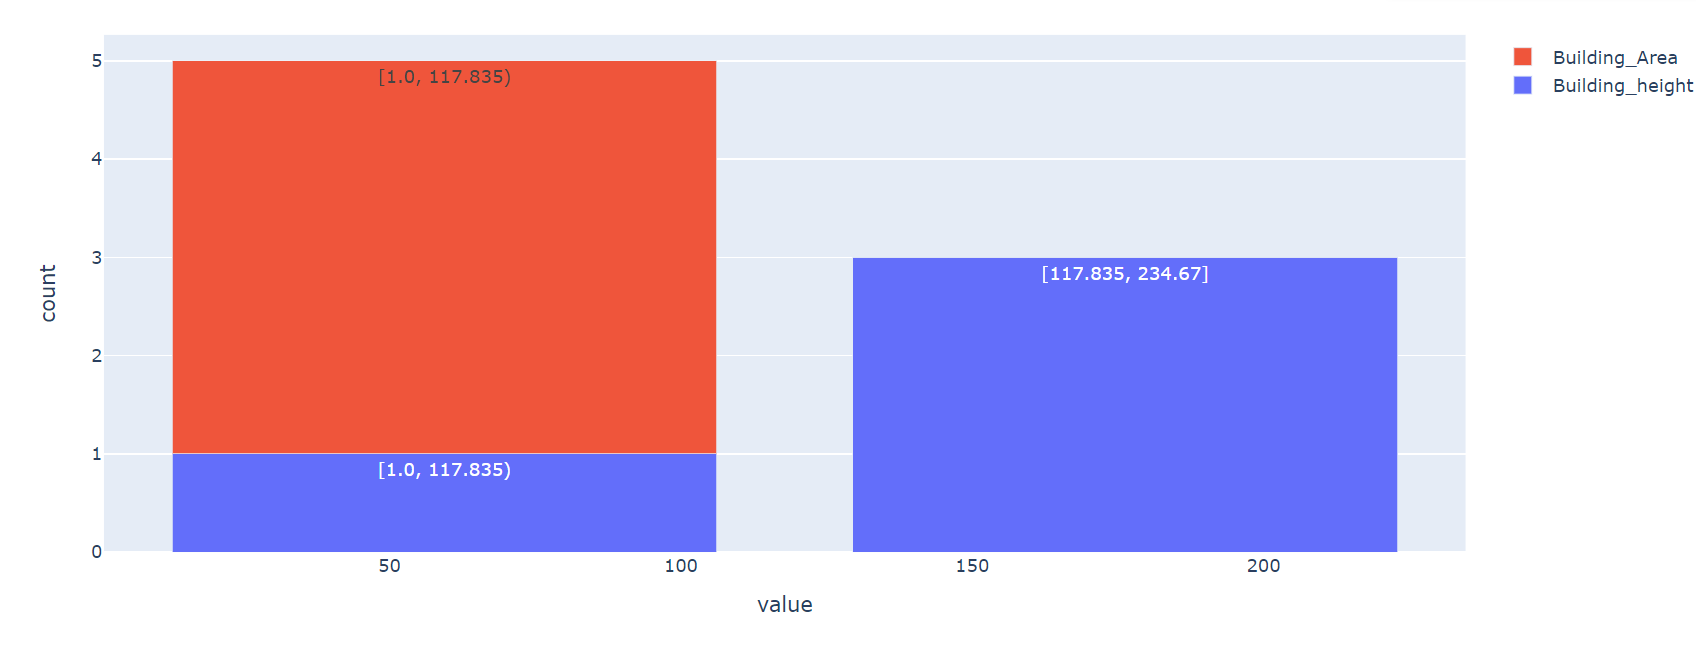
As we specified, only 2 bins and 2 bars were created. Four rows are binned into 2 buckets here.
Plot Histogram on the PySpark RDD by Specifying Bucket Number
When you are working with RDD, histogram can be returned in the form of a tuple that includes the buckets and total values that are present in each bucket.
Syntax:
In this scenario, we pass the number of buckets (integer) that are included in Histogram. It returns the tuple of lists that include the bucket ranges and corresponding value occurrences in the following format: ([bucket ranges…], [value occurrences…]).
Example 1:
Let’s create an RDD named “Building_height” with 10 values and create a histogram with 3 buckets.
from pyspark.sql import SparkSession
from pyspark.rdd import RDD
spark_app = SparkSession.builder.appName('linuxhint').getOrCreate()
# Create an RDD with 10 values
Building_height =spark_app.sparkContext.parallelize([120.56,234.67,12.0,200.45,17.8,24,56,78,90,100])
print("Actual: ",Building_height.collect())
# Specifying 3 buckets
Building_height.histogram(3)
Output:

- Bucket-1 ranges from 12.0 to 86.223 : In this range, the total number of values present in the bucket are 5.
- Bucket-2 ranges from 86.223 to 160.446 : In this range, the total number of values present in the bucket are 3.
- Bucket-3 ranges from 160.446 to 234.67 : In this range, the total number of values present in the bucket are 2.
Example 2:
Create a histogram with 2 buckets on the previously created RDD.
from pyspark.sql import SparkSession
from pyspark.rdd import RDD
spark_app = SparkSession.builder.appName('linuxhint').getOrCreate()
# Create an RDD with 10 values
Building_height =spark_app.sparkContext.parallelize([120.56,234.67,12.0,200.45,17.8,24,56,78,90,100])
print("Actual: ",Building_height.collect())
# Specifying 2 buckets
Building_height.histogram(2)
Output:

- Bucket 1 ranges from 12.0 to 123.335. In this range, the total number of values that are present in the bucket is 8.
- Bucket 2 ranges from 123.335 to 234.67: In this range, the total number of values that are present in the bucket is 2.
Plot Histogram on the PySpark RDD by Specifying the Size of Each Bucket
In the previous scenario, we passed the buckets to the RDD.histogram() function. Now, we pass the bucket sizes one after another inside a list and pass this list as a parameter to this function. Make sure that we need to specify at least two buckets in increasing/ascending order and it won’t have duplicate values.
Syntax:
In this scenario, we pass the number of buckets (integer) that are included in the histogram. It returns the tuple of lists that include the bucket ranges and corresponding value occurrences in the following format: ([bucket ranges…], [value occurrences…]).
Example 1:
Let’s create an RDD named “Building_height” with 10 values and create a histogram with the bucker range of values [0, 50, 100, 150, 200, 250].
from pyspark.sql import SparkSession
from pyspark.rdd import RDD
spark_app = SparkSession.builder.appName('linuxhint').getOrCreate()
# Create an RDD with 10 values
Building_height =spark_app.sparkContext.parallelize([120.56,234.67,12.0,200.45,17.8,24,56,178,90,100])
print("Actual: ",Building_height.collect())
# Specifying bucket with size - [0,50,100,150,200,250]
Building_height.histogram([0,50,100,150,200,250])
Output:

- Bucket 1: (0 to 50) : Total values in this bucket are 3.
- Bucket 1: (50 to 100) : Total values in this bucket are 2.
- Bucket 1: (100 to 150) : Total values in this bucket are 2.
- Bucket 1: (150 to 200) : Total values in this bucket are 2.
- Bucket 1: (200 to 250) : Total values in this bucket are 2.
Example 2:
Create a histogram with the bucket range of values [0, 100, 200, 300].
from pyspark.sql import SparkSession
from pyspark.rdd import RDD
spark_app = SparkSession.builder.appName('linuxhint').getOrCreate()
# Create an RDD with 10 values
Building_height =spark_app.sparkContext.parallelize([120.56,234.67,12.0,200.45,17.8,24,56,178,90,100])
print("Actual: ",Building_height.collect())
# Specifying bucket with size - [0,100,200,300]
Building_height.histogram([0,100,200,300])
Output:

- Bucket 1: (0 to 100). The total value in this bucket is 5.
- Bucket 2: (100 to 200). The total value in this bucket is 3.
- Bucket 3: (200 to 300). The total value in this bucket is 2.
Conclusion
We have seen how to create histograms in PySpark on PySpark Pandas DataFrame and RDD. histogram() is the function that is used to get the histogram on RDD data. The plot.hist() is used to display the histogram on PySpark Pandas DataFrame. We discussed these functions with examples by covering all the parameters.