All signals provided to the traced process, except for one, cause it to stop, regardless of its registered signal processing, and deliver an event towards the tracing process, which may be identified using the wait () system function. The SIGKILL signal is an exception, as it is delivered instantly and accomplishes the expected behavior. There has never been a standard for Ptrace system call. Its interface is comparable across operating systems, notably in terms of essential functionality, but it differs slightly from one system to the next.
System calls can be traced using the Linux edition of ptrace. The PTRACE SYSCALL request restarts the child process in the same way that PTRACE CONT does, but it arranges for it to stop at the next system call entry or exit. This brings up a lot of new opportunities. For PTRACE PEEK requests, ptrace() will return the desired data; it will return zero for all the other requests. All requests that fail return -1, with errno set to the optimum value. In the case of PTRACE PEEK requests, -1 may be a legitimate return value; the program is responsible for determining whether this is an error situation or a valid return value. This guide will explain to you the functionality of the ptrace() system call in C language with one example.
Example to understand ptrace() system call in C language
To understand the ptrace() system call in C language, we use Ubuntu 20.04 Linux system to implement its example. GCC compiler has been already installed in our system for the execution of code. You may install it by using the below-cited instruction in the terminal shell of the Ubuntu 20.04 Linux system.
Now, let’s start with our example. Create a file with any of your desired names with the .c extension in the terminal by using nano instruction. You can directly create the file by going to any home directory or using the “touch” command as well. The purpose of using nano instruction is to open the GNU editor over the terminal directly. Now execute the below-cited instruction in the terminal shell of the Ubuntu 20.04 Linux system.
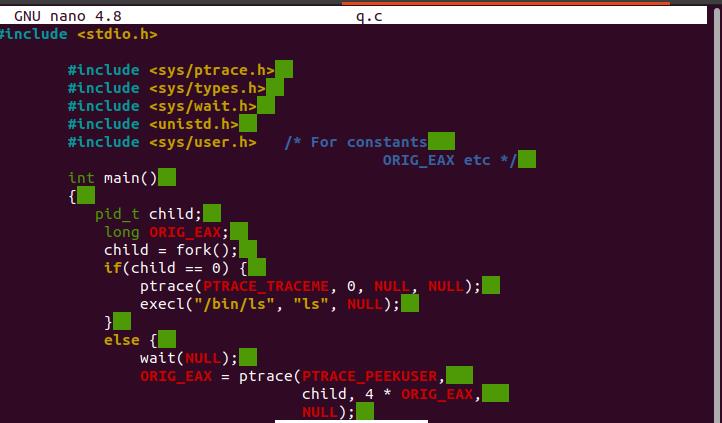
GNU nano 4.8 will appear on your screen. Now write the code displayed in the below-attached image.
In the above-attached code, we have utilized some standard libraries. PTRACE TRACEME specifies that the parent of this process should be able to track it. If its parent is not expecting to track it, a process should just not submit this request. The PID, addr, and data are not reserved into account. The tracee is the only one who uses the PTRACE TRACEME call; the tracer only uses the other requests. The parent process forks a child’s process and monitors it in the scenario above. The sub-process runs the ptrace function with PTRACE TRACEME as the first parameter before invoking the exec function, which informs the kernel: the child process then controls the parent process after calling execve().
The parent process was using the wait () function to wait for kernel alerts, and now that it has been notified, it can observe what the child processes have been doing, such as inspecting register values. The kernel saves the entire features of the “eax” register, which grasps the number of system call whenever the system call happens. PTRACE PEEKUSER Read a word from the tracee’s user section, which contains the process’s registers and other data (sys/user.h>). As a consequence of the ptrace() call, the string is returned. The offset must usually be word-aligned, though this may vary depending on the architecture.
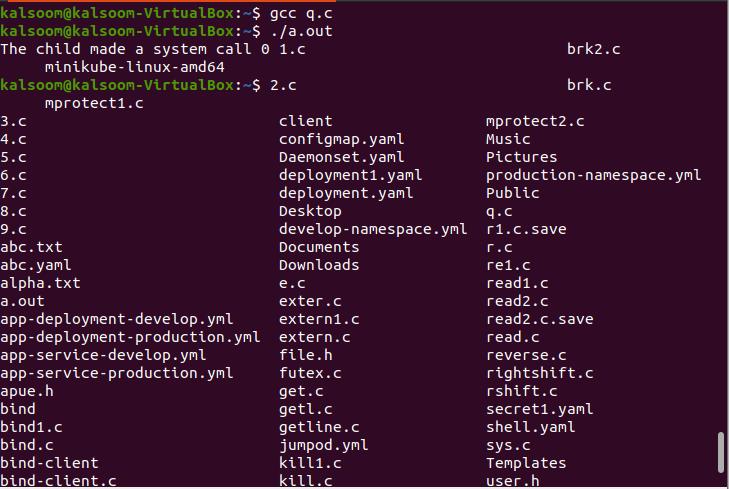
PTRACE CONT resumes the tracee process if it has been halted. If data is not zero, it is understood as the number of signals to be sent to the tracee; then, no signals are sent. The tracer, for instance, can regulate whether or not a signal sent to the tracee is transmitted. The compilation and execution can be done by executing the below-cited instructions in the terminal shell of the Ubuntu 20.04 Linux system.
$ ./a.out
The successful output has been shown in the above-attached image.
Conclusion
The ptrace() system call has been widely used in the C programming language, but it may identify and change a running program; the ptrace function may seem weird. Debuggers and systems call trackers commonly employ this technique. At the user end, it enables programmers to do more interesting stuff. This article provided the basic understanding and implementation of the ptrace() system call. The example code can be amended if required/


