Getting Started with the ps Command in Linux:
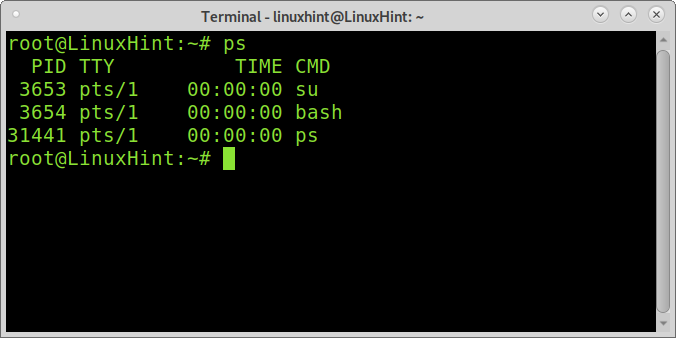
To start, let’s run the command ps without parameters. In this case, the command ps will show only processes executed by the root user.
Understanding the ps Command Output:
The 4 columns displayed contain the following information:
- PID: Process ID, shows the process identification number.
- TTY: Identifies the terminal from which the process was executed.
- TIME: Shows the processor’s time occupied by the program.
- CMD: Shows the command used to launch the process.
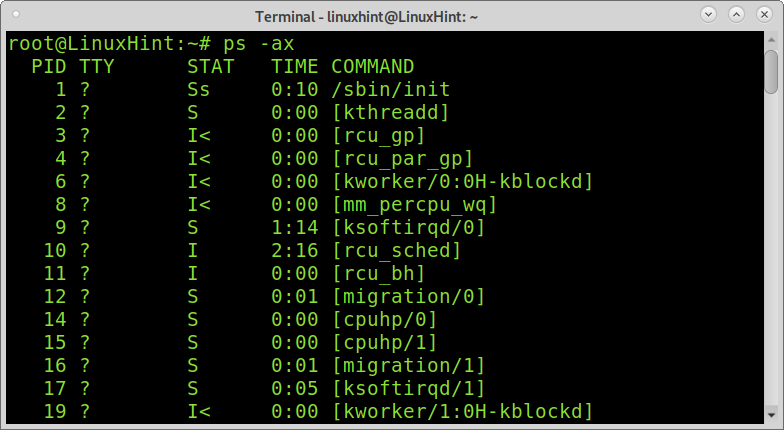
If you want to show all users processes you need to add the flag –ax as shown below:
The flag –a used in the screenshot below indicates ps to display all processes except both session leaders and processes not associated with terminals. The flag –x shows processes without a controlling terminal and processes with a controlling terminal.
Note: A session leader is a process whose PID and SID are the same.
Most Linux users execute ps -axu. The flag -u shows the effective user of a process. An effective user is the user whose file access permissions are used by the process (this subject is explained in the tutorial Setuid, setgid, and sticky bit explained).
As you can see in the screenshot below, by adding the -u flag new columns will show up.
The columns display the following information:
USER: shows the effective user, whose permissions are used to run the process.
%CPU: This column displays the calculation of time used by the process divided by the time the process is in execution.
%MEM: This column shows the RSS (Resident set size) divided by the used memory. This column isn’t recommendable for users to check the memory use because the used memory amount isn’t exact. If you want to check memory use by process, you can read How to Check Memory Usage Per Process on Linux.
VSZ: Shows the virtual memory used by the process.
RSS: Resident set size. Shows the memory occupied by a process in the ram memory (not in swap).
START: This column shows when the process started.
TIME: CPU usage of process or thread, incremented each time the system clock ticks and the process or thread is found to be running
COMMAND: This is the same as the previously explained CMD column.
STAT: The column stats show code states for the process. Possible code stats explained in ps man page are:
- D uninterruptible sleep (usually IO)
- I Idle kernel thread
- R running or executable (on run queue)
- S interruptible sleep (waiting for an event to complete)
- T stopped by job control signal
- t stopped by debugger during the tracing
- X dead (should never be seen)
- Z defunct (“zombie”) process, terminated but not reaped by its parent
- < high priority (not nice to other users)
- N low priority (nice to other users)
- L has pages locked into memory (for real-time and custom IO)
- s session leader
- l is multi-threaded (using CLONE_THREAD, like NPTL pthreads do)
- + is in the foreground process group.
Showing a Specific User Processes Using ps:
If you want to check only processes executed by a specific user (Effective User), you can use -u flag; explained previously without additional flags, followed by the username whose processes you want to list. This will show the effective user, whose permissions are used to run the process, but not the user who called the process (Real User).
Note: If you don’t know what effective and real users are, the explanation is at the end of this section.
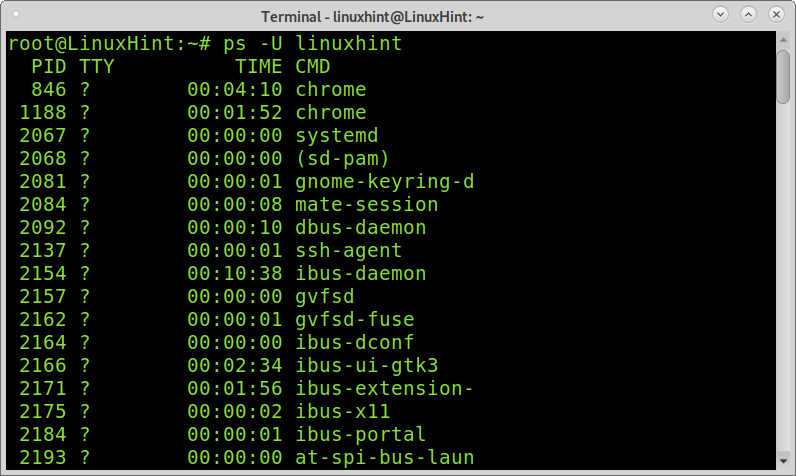
The following example shows processes for the user linuxhint as an effective user.
If instead of checking effective users you want to check processes executed as real users, just use a capital U instead.
Effective Users vs Real users:
The Real User ID represents the user who executes a process. For example, the user who calls a program in the terminal. The Effective User ID represents the user whose permissions are being used to execute a program. This is applicable, for example, when a user runs a program with setuid. The same happens with groups, and we can identify effective and real groups. If you don’t understand this subject, you can read the setuid, setgid tutorial.
Showing a specific user processes using ps:
If you want to show real group processes, a capital -G followed by the group will display it.
If you want to show effective groups, add the -g flag followed by the effective group.
Showing Processes Hierarchy:
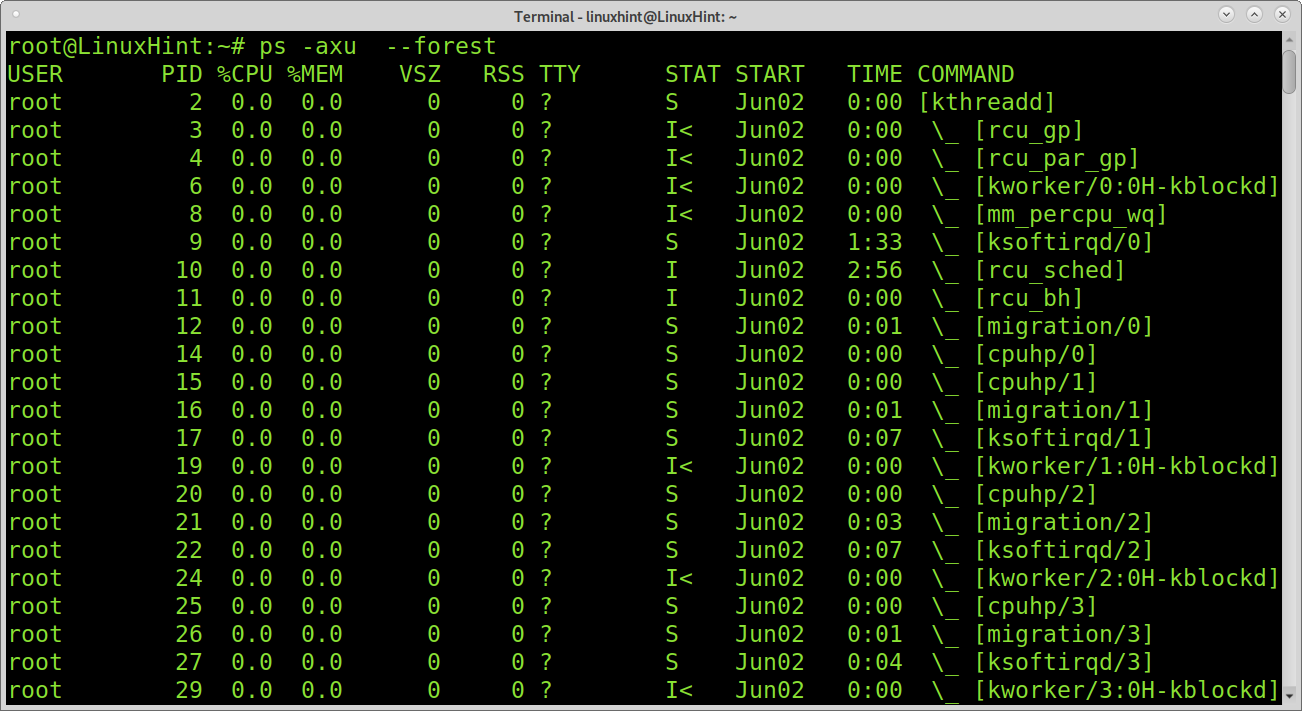
The flag –forest allows you to display processes showing hierarchy and associated processes as shown in the screenshot below.
Show Processes by TTY:
You can also use the ps command to display what processes were started by a specific terminal, or to what terminal processes belong. You can implement it by adding the -t flag followed by the tty you want to identify, as shown in the example below.
Showing Additional Information on Processes:
There are different ps versions: Unix, BSD and GNU versions. This tutorial is optimized for the Unix version. You can display the BSD version with additional information by adding the -l flag as shown in the screenshot below. It will add new columns with additional information.
As you can see, the new columns are UID, PPID, PRI, NI and WCHAN.
UID: Shows the ID of the user who executed the process.
PPID: Shows the PID parent process.
PRI: Shows the process priority (Kernel)
NI: Shows the process priority (User space)
WCHAN: Shows the name of the kernel function in which the processes sleep.
There are a lot more on the command ps you can read on the man page or on a next tutorial Linux Hint will release on the ps command for advanced users.
Conclusion:
The command ps is a basic command any Linux user must know how to apply and understand. Learning to use and interpreting the output is a real way to incorporate additional knowledge, like effective and real users and groups.
As shown in this tutorial, any Linux user level can easily learn how to implement this command with all available flags and options.
I hope this tutorial was useful. Keep following Linux Hint for more Linux tips and tutorials.


