Getting Started With netstat
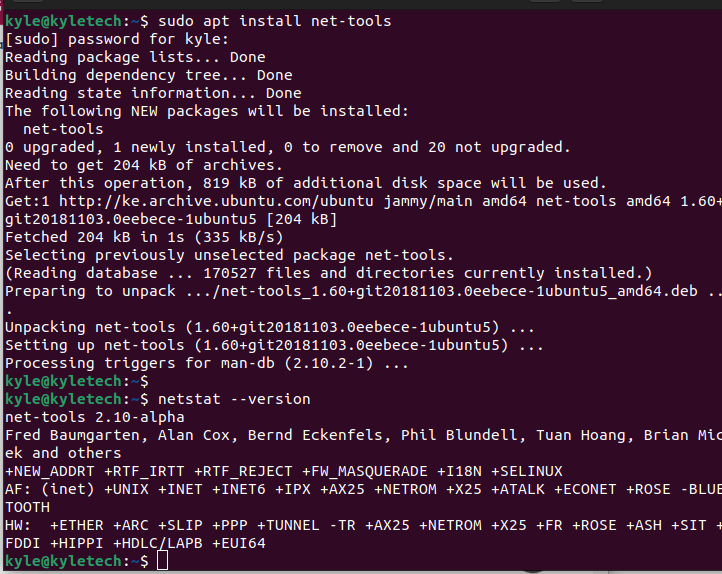
The network statistics (netstat) is a command-line network analytics tool installed along with net tools. You can install it on Ubuntu using the command below.
With net tools installed, we can see the various options to use with the netstat command.
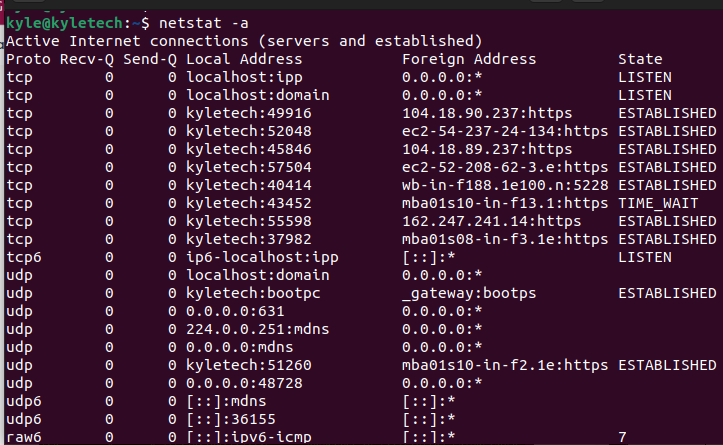
1. netstat -a: it displays all listening ports for UDP and TCP and their state.
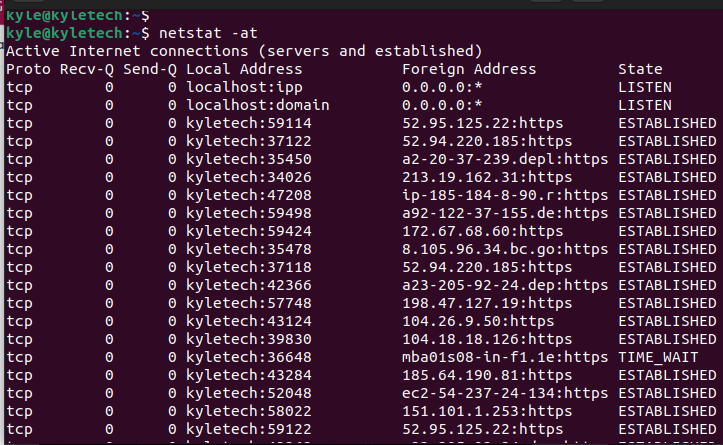
2. netstat -at: if you need only to filter the tcp ports, use the -at option, and you will note the image below will only display tcp ports and their state.
In the above output, you will note that we are displaying even the inactive ports, which won’t be helpful when analyzing a large network. The solution is to filter and only display the open ports. For this, you need to use the –l option followed by the protocol.
Our new command would be:
In the output below, we are listing only the listening tcp ports.
3. netstat -au: similarly, you can only filter the UDP ports using the -u option.
To filter the UDP ports and only get the listening ports, the command will be:
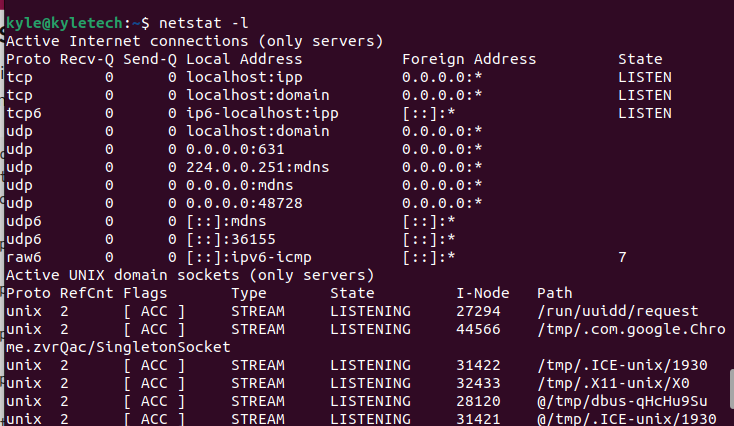
4. netstat -l: if you want to list all listening ports without specifying the protocol, use the -l option.
Note that we are also getting the statistics for UNIX. We can separate them using the next command.
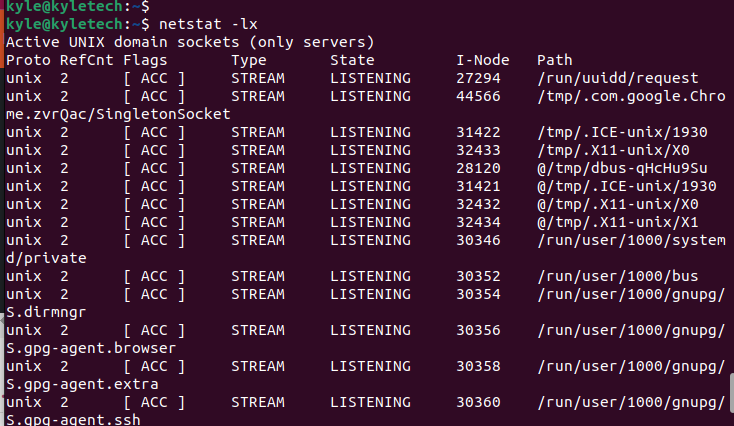
5. netstat -lx: to view the UNIX active listening ports
So far, we’ve seen how to use netstat to filter ports based on a given protocol. You can take the statistics further to get the statistics for ICMP, TCP, UDP, and IP protocols. For this, you need to use the -s option.
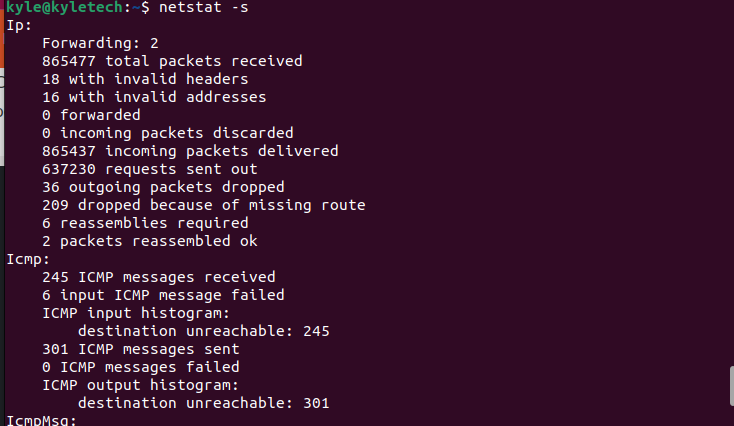
6. netstat -s: list statistics based on protocol. This option helps narrow down activities on your network for easy analysis by separating each protocol.
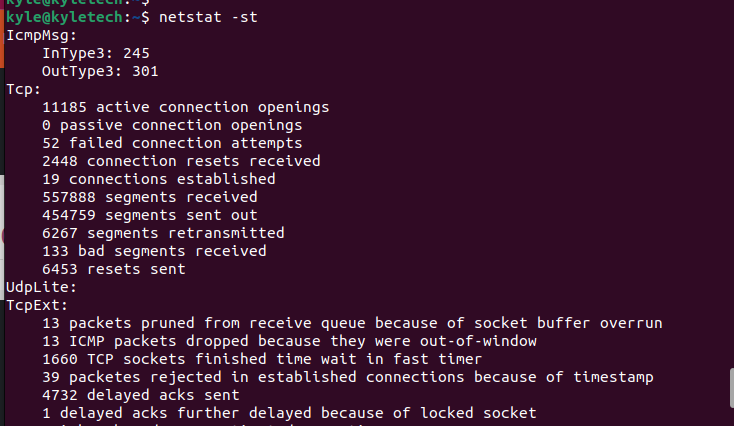
In the output above, you can not the statistics are displayed for all protocols but in an organized manner. If you want the same statistics for TCP or UDP, you can add the -t and -u, respectively.
Use the commands below.
$ netstat -su
7. netstat -p: it displays services of a given protocol with their process ID. For instance, to get the service name for TCP with their PID, the command would be:
8. netstat -r: the command displays your kernel’s IP routing table
9. netstat -ap: displays all active listening programs on a given port. You can combine it with the grep command to filter the output. For instance, to get those running on HTTPS, the command would be:
If you ever get stuck using netstat, open the netstat –help to see the list of various commands that you can use. However, the above are common, and you can modify them with other Linux commands to achieve more functionality.
Conclusion
This guide covered the netstat -a command in Linux and the various examples of its usage. The netstat tool is one you can’t sideline when analyzing your network. Besides, it offers multiple commands to use to filter the output of your network analysis. Feel free to try various ways to combine netstat with other commands for more productivity.

