The article details the working of MTR, provides some command-line examples and explains the data it generates. In the end, given the output, we perform report analysis.
How Does MTR Work?
Network diagnostic tools, such as ping, traceroute, and MTR probe the connection between two devices with ICMP packets for troubleshooting network connectivity. While the ping utility uses ICMP echo_request and echo_replies, in contrast, traceroute and MTR use ICMP packets with time-to-live TTL.
For hop-to-hop analysis, at first, MTR establishes addresses of the switches, gateways, and routers between the local and remote devices. Then, it uses the ICMP packets with TTL to ping each hop such that the TTL controls the nodes the packet will reach before dying. Hence, it sends a series of ICMP echo_request with the TTL set to one, two, three, and so on until MTR assembles the whole route.
The above process outputs stats that contain additional information, such as hop state, network connection, node responsiveness, network latency, and jitter. Most interestingly, it’s similar to the top command as it keeps refreshing with real-time network connectivity.
MTR Installation
By default, the tool lives in the /user/sbin directory as it comes preinstalled with most distributions. If it isn’t available, install MTR with the distribution’s default package manager.
For Ubuntu:
For RHEL:
For Arch:
Generating and Reading Live MTR Reports
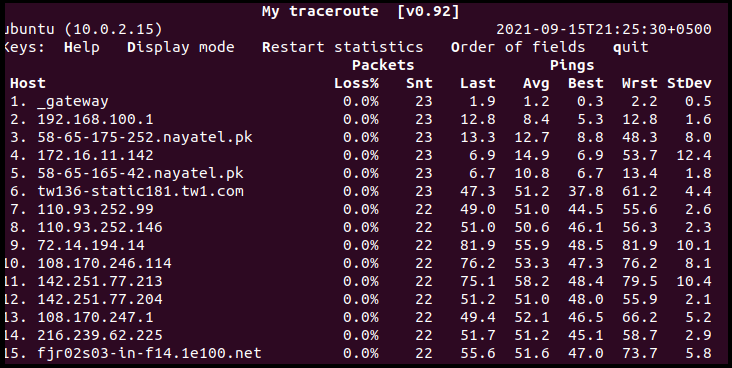
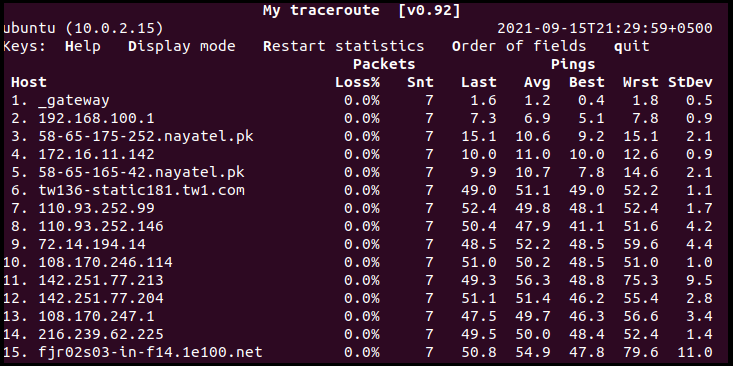
As shown in the screenshots above, apart from listing network hops, MTR also keeps track of the latency. In other words, it also estimates the round trip time from the local machine to each device on the path.
For a better idea, use the –report flag to generate a report constituting statistics regarding network quality. Users can also utilize this with the -c option, as it will only run for the number of cycles specified by it and exit after printing statistics.

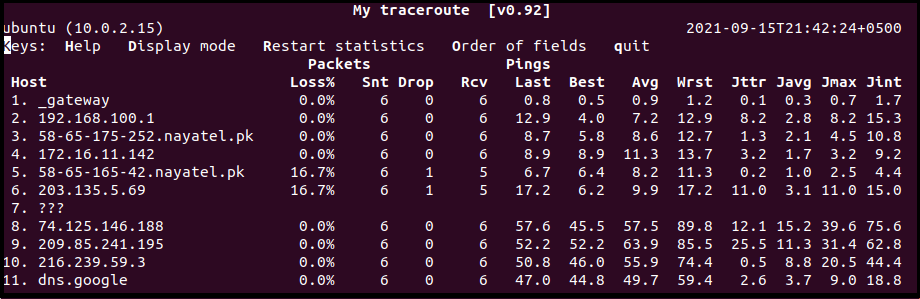
The previous screenshot outputs several fields/columns to access network traffic. These columns report the following statistics:
- %Loss: packet loss percentage at each machine
- Snt: Number of sent packets
- Last: The round trip time for the last traceroute packet
- Avg: The average round trip time for all probes
- Best: Shortest round trip time of a packet to a particular host
- Wrst: Longest round trip time of a packet to a host
- StDev: Standard deviation of latencies
The Snt to Wrst columns measure latencies in milliseconds, but only the Avg column matters the most. The only downside for generating reports for network quality is that it utilizes a lot of network traffic that degrades network performance.
Useful Options
The following section contains some of the most helpful MTR flags command examples. We will explain the output details in the MTR Report Reading section later.
IPv6: MTR uses IPv6 as the default option, which requires including the IP address or domain name of the destination host as an argument. It will display a real-time output press Ctrl+C or q to exit:
or
IPv4 only: The IPv4 switch (-4) displays only IPv4 addresses and includes Fully Qualified Domain Names:
b: To display both the domain names and IPv4 addresses, use the -b flag as follows:
c: As discussed earlier, the flag limits the number of pings sent to each machine. After completing the number of pings, it stops the live update and exits MTR soon afterward:
T/u: Replace the ICMP echo packets with TCP SYN -T/–tcp or UDP datagrams -u/–udp:
or
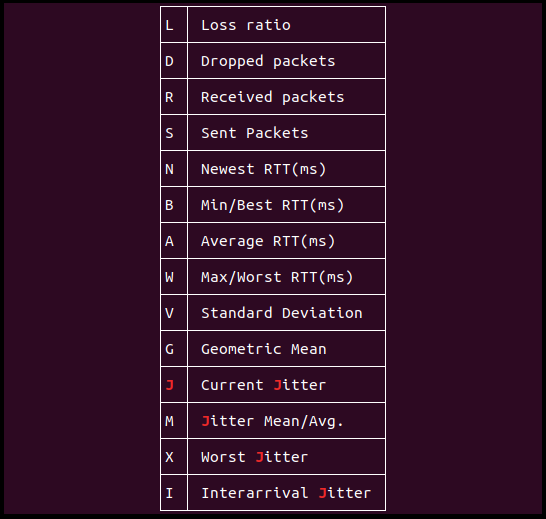
o: Arrange the output field as per your requirement. For instance, the given command displays output in the following fashion:
m: Specify the hops between the local host and remote machine. The following examples sets the hops to 5, while the default value is 30:

s: Probe the network by specifying ICMP packet size, including IP/ICMP headers in bytes:
Report Analysis
MTR output report analysis mainly constitutes or is focused on packet loss and network latency. Let’s discuss each of these in detail:
Packet Loss
The MTR report generates a percentage of packet loss field at each hop to indicate a problem. However, service providers have a common practice of rate-limit MTR ICMP packets that give an illusion of packet loss, which isn’t true. To identify if the packet loss is actually due to rate-limiting or not, note the packet loss of the subsequent hop. As in the screenshot above, for –o flag example, we observe a packet loss of 16.7% at hop 5 and 6. If there is no packet loss at the next device, then it results due to rate-limiting.
In another scenario, if the reports represent different amounts of loss at the starting subsequent hops and the later few devices show the same packet loss percentage, then the loss at the initial machines is due to both factors: rate-limiting and actual loss. Hence, when MTR reports different packet loss at various hops, trust the loss at the later hops.
Network Latency
The latency of a network increases with the number of hops between two endpoints. However, latency also depends on the network connection quality between the local and remote machines. For instance, dial-up connections show higher latency than cable modems.
It’s also important to note that network latency does not imply an inefficient route. Irrespective of the high network latency at various nodes, packets can reach the destination and return to the source with zero loss.

In the example above, we observe a jump in latency from the 8th hop onwards, but no packet was lost except at the destination host.
Conclusion
Understanding the basics of MTR is necessary to grab and figure out the most common network connectivity issues, such as improper configuration of ISP/residential router and destination host network, timeouts, and ICMP rate limiting. The article builds a ground for a beginner user to understand the usage and working of MTR. It also shows how to generate MTR reports and perform analysis to identify rate-limiting related packet loss issues and analyze network latency.