IPTRAF
VNSTAT
IFSTAT
IFTOP
Related articles
Brief introduction
This tutorial goes deep on network stats for Linux users describing IPTRAF, VNSTAT, IFSTAT and IFTOP being IPTRAF and VNSTAT the most complete programs listed with a variety of options for monitoring customizations. All programs included in this article are available on Debian and Ubuntu repositories and their official urls are shown for users using different distributions.
IPTRAF
Iptraf is a very friendly console interactive tool to monitor traffic statistics including many customization options, together with vnstat it is the most complete tool shown in this tutorial. It is also available on Debian and Ubuntu repositories, you can download it for different distributions at https://github.com/vergoh/vnstat.
To install Iptraf on Debian and Ubuntu based systems run:
Run Iptraf executing:
Note: run iptraf-ng and no iptraf or you’ll get an error like “bash: iptraf: command not found“, this tool needs your terminal to be properly sized to work, maximize your terminal when running it.
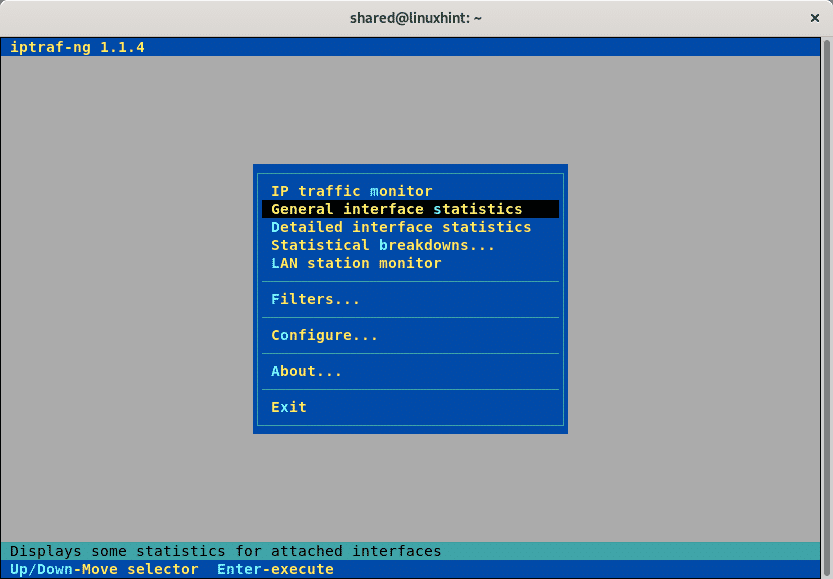
Once executed Iptraf main menu is displayed, to begin learning this menu press ENTER on the first option “IP traffic monitor”.
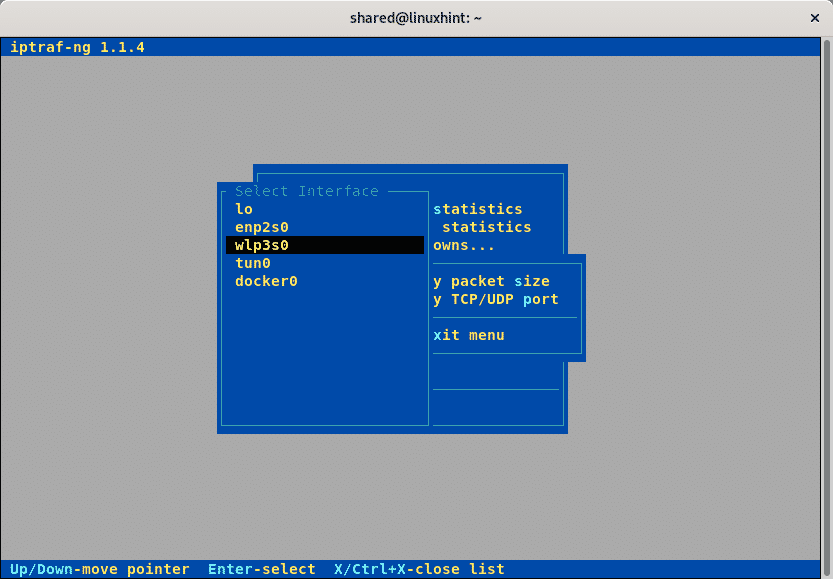
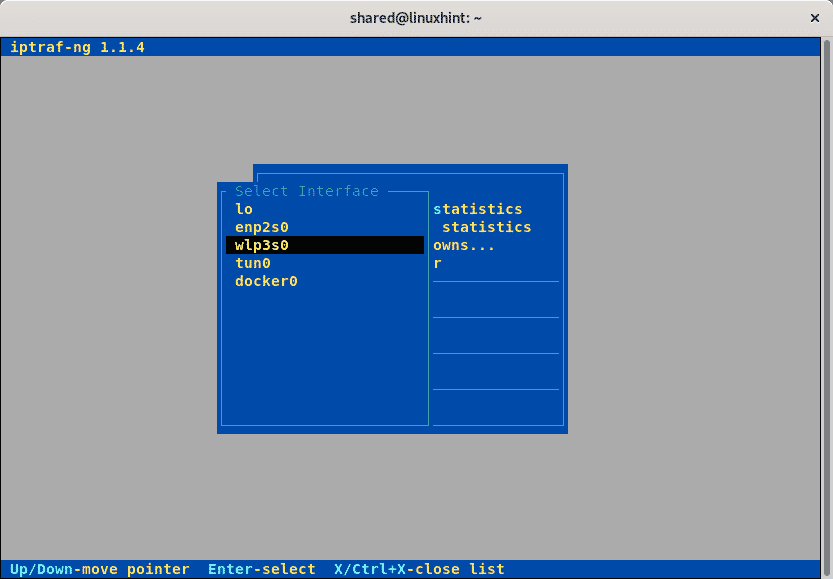
Iptraffic will let you select the network card you want to monitor, or all them, in my case I chose wlp3s0, select your proper network card,or all them, and press ENTER.
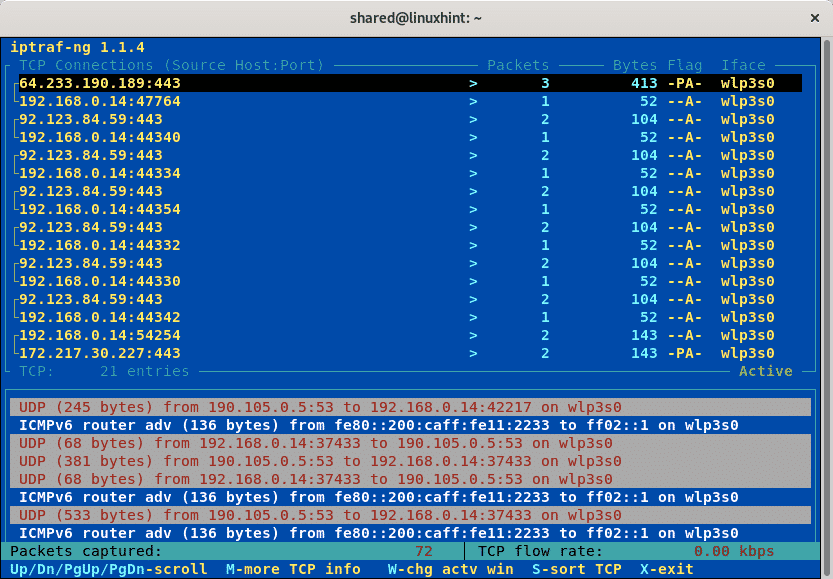
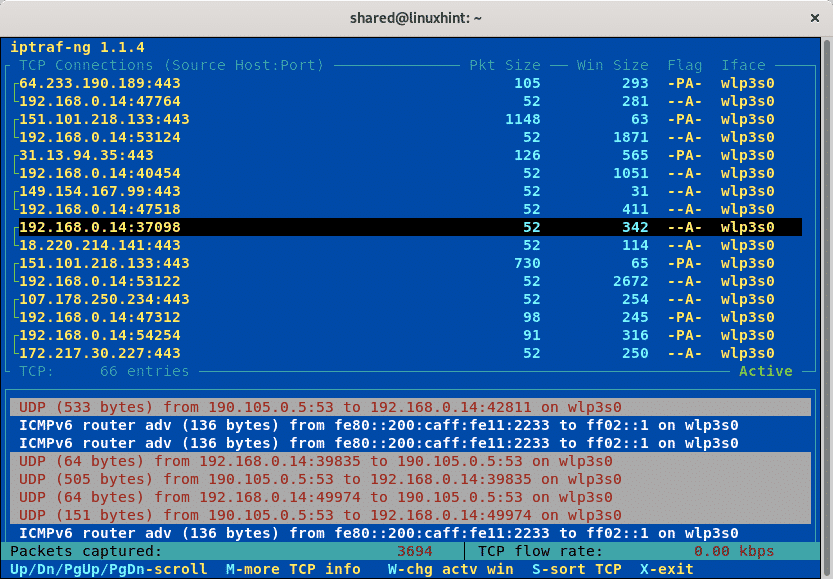
On the new screen you see your traffic on live view, you can move between lines with your arrow keys and display additional information by pressing M (more).
The default view shows the packets quantity, when pressing M you can see the size.
Press Esc to go back to the main menu.
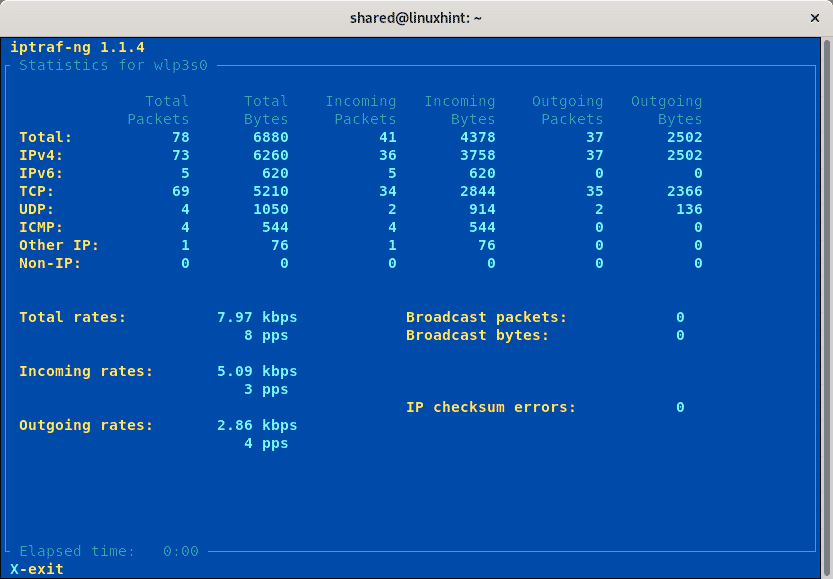
With the keyboard arrows move to the next options on the main menu, to “General interface statistics“.
In this screen you can find summarized statistics for all your network cards together.
Press Esc again to go back to the main menu.
On the main menu, go to the option “Detailed interfaces statistics” and press ENTER.
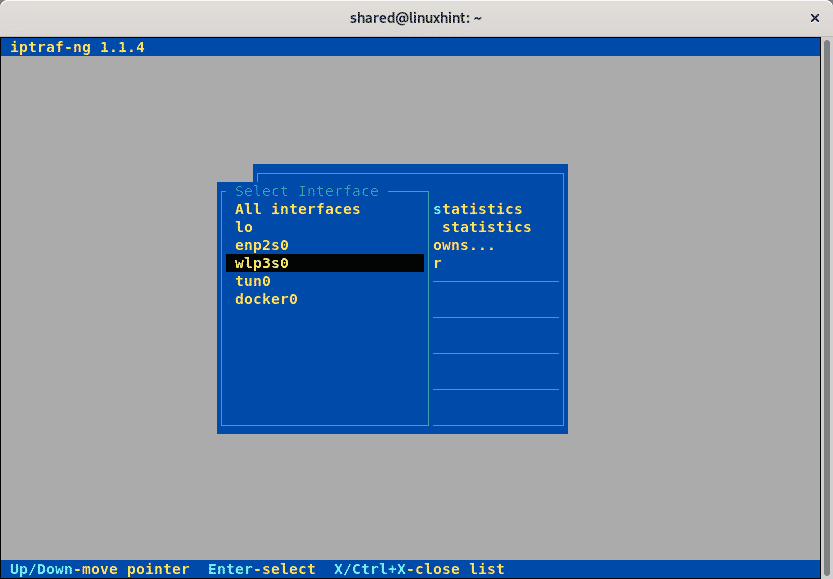
In this menu you can select the network card you want detailed statistics on individually, select your card and press ENTER.
Browse to “Statistical breakdowns” and press ENTER.
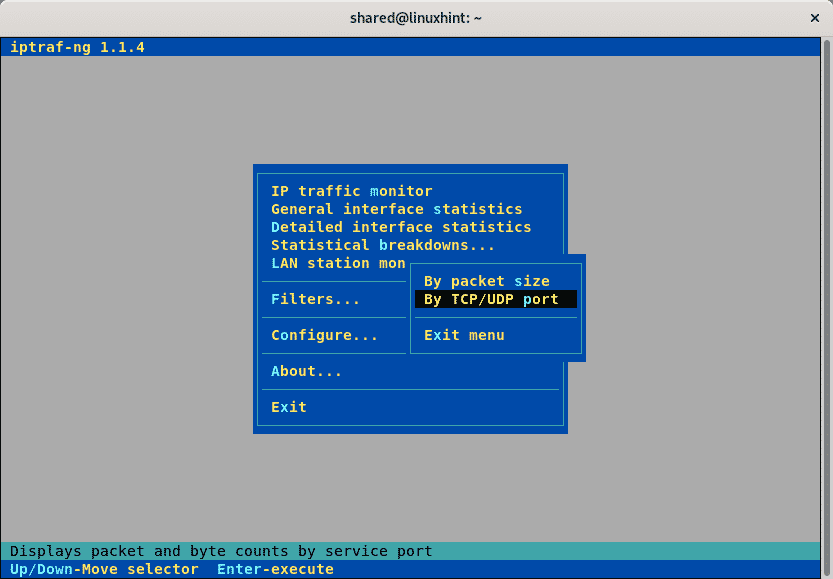
In this menu you can select statistics by packet size or protocol, select any and press ENTER.
Select your network card and press ENTER.
The section shows the packet sizes going through the network by port and protocol. Press Esc to go back to the main menu.

Select your network interface or all them and press ENTER.
This section shows the MAC addresses and the incoming and outgoing packets, units are expressed in kb/s.
Go back to the main menu by pressing Esc.
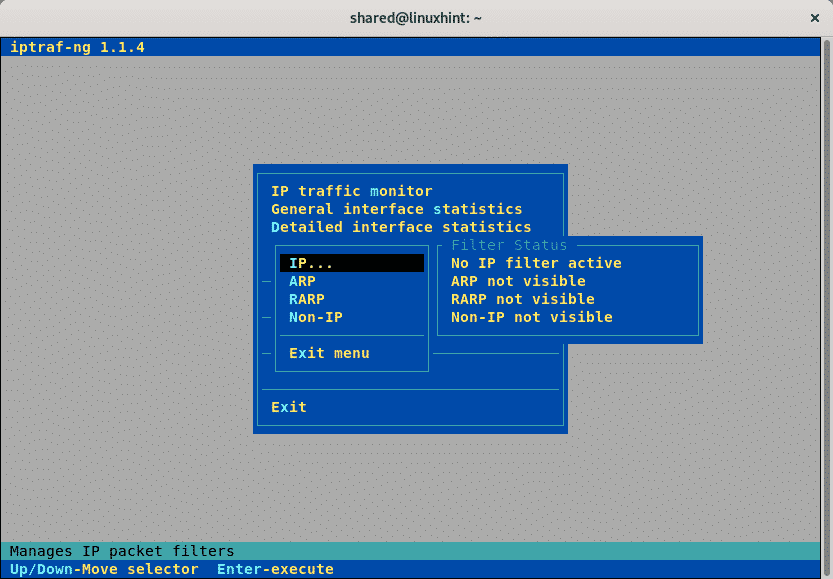
On the main menu press ENTER on Filters.
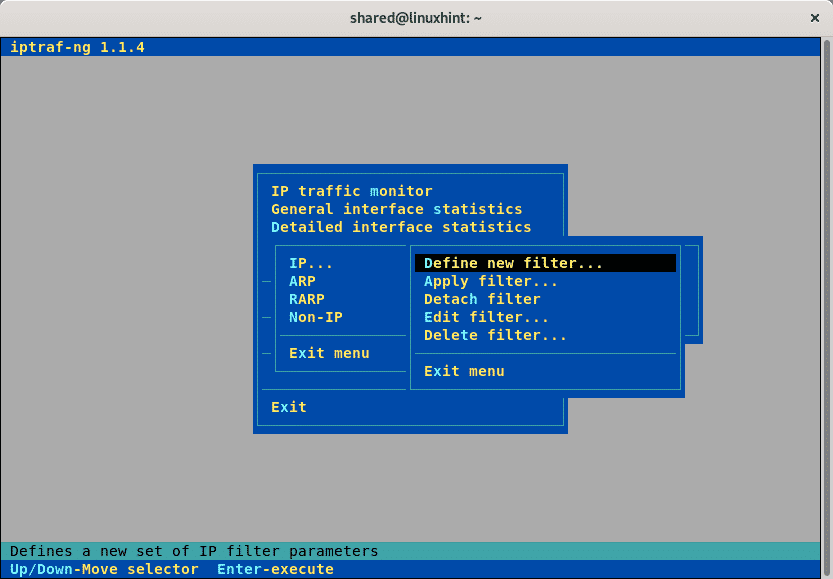
You can see filter options for IP,ARP, RARP and Non-IP packets and on the right side the current configuration enabled or disabled for each, press ENTER on any of the options.
Select “Define new filter” and press ENTER.
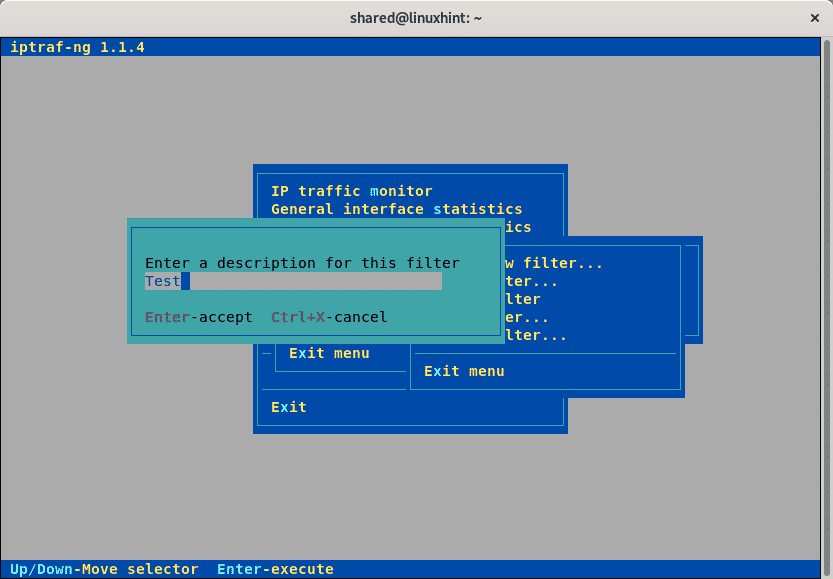
Set your filter name and press ENTER.
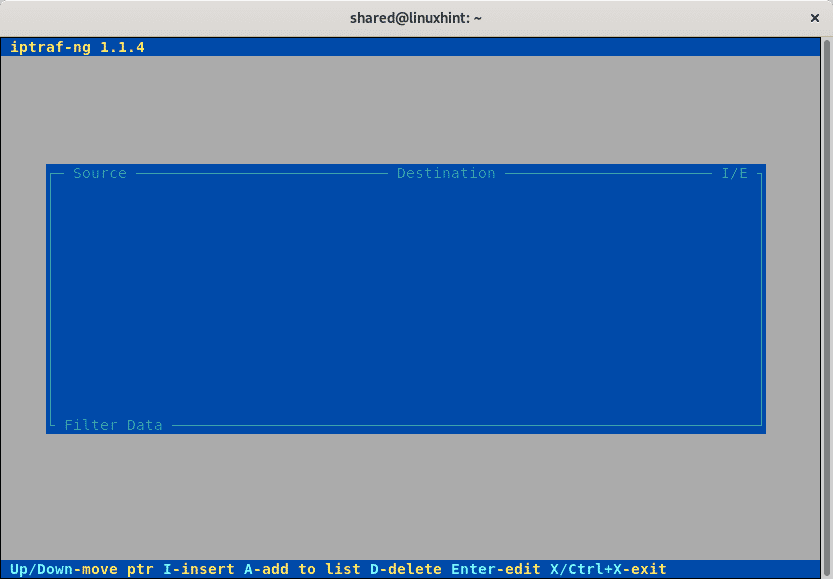
To add a new filter press the key I (insert).
Here you can define your filter rules, such as source and destination IP addresses, ports and more, below you can select if include or exclude.
Press Esc to go back to the main menu.
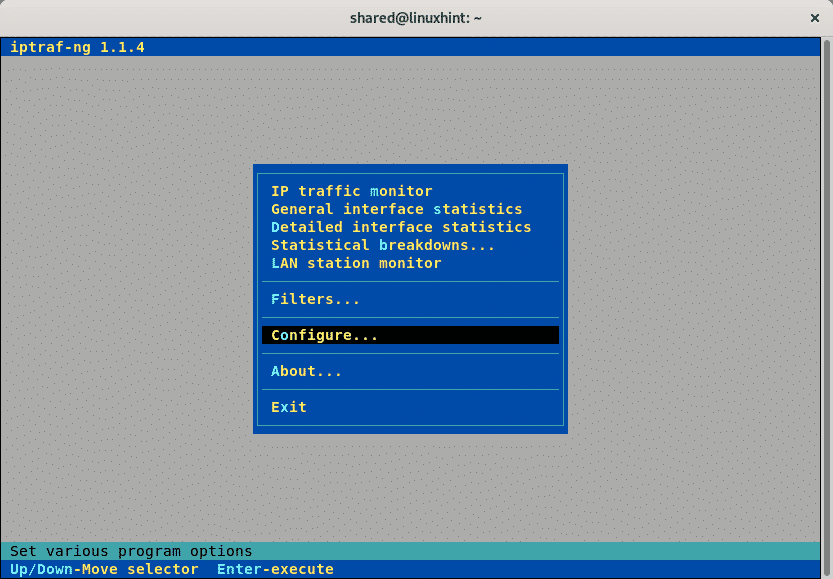
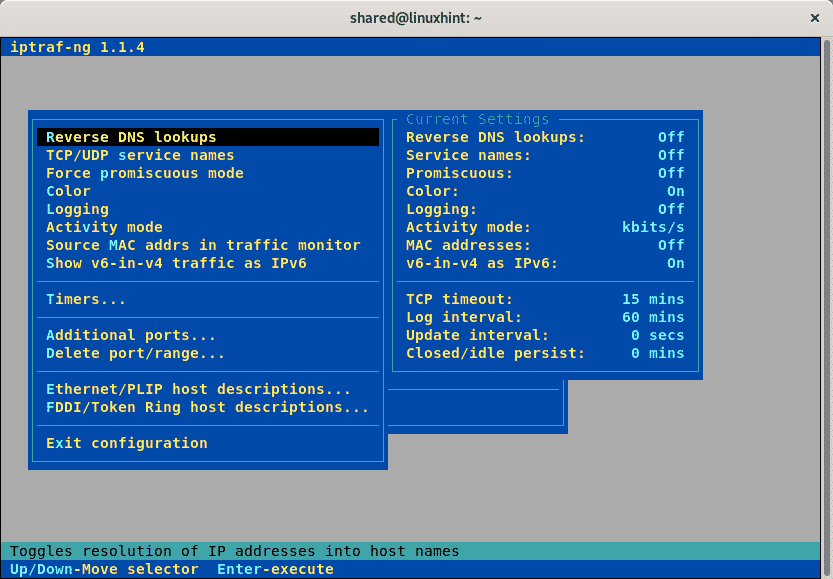
On the main menu browse to Configure and press ENTER.
Here you have many options such as logging statistics, format modes and more, you can browse all options and set any you want.
To exit this menu move to “Exit Configuration” and press ENTER.
VNSTAT
Vnstat is a traffic monitor available for Linux and BSD systems, it is included in Debian and Ubuntu repositories, other Linux distribution users can get it as tar.gz from https://humdi.net/vnstat/.
To install vnstat on Debian and Ubuntu run:
Once installed vnstat needs to be configured properly, run:
Inside the configuration file you’ll find the line “#default interface” and below it “Interface eth0”, if your network card is identified as eth0 you should leave it, but if your network interface is different replace it, in my case I’d set wlp3s0 to monitor my wifi card. You can also edit the location of the db, when timing should be updated, date formats and more options.
Once replaced if needed, press CTRL+X and Y to save and exit.
To run vnstat, on the terminal just run:
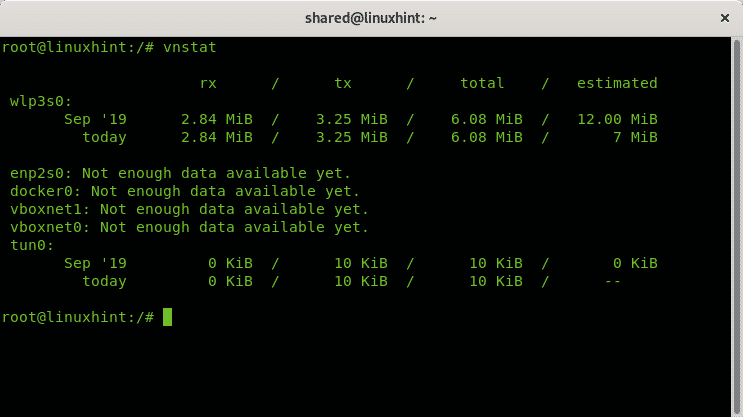
Output:
Contrary to the rest of monitors explained in this tutorial, vnstat runs on background and logs all traffic allowing the user to display it monthly, weekly,daily or hourly basis among more options you can see by running vnstat —help.
IFSTAT
Ifstat is a very simple tool for traffic statistics, it is also included in Debian and Ubuntu repositories, other Linux distribution users can find ifstat at http://gael.roualland.free.fr/ifstat/.
to install ifstat on Debian or Ubuntu run:
To launch ifstat run:
IFTOP
Iftop is another tool available on Debian and Ubuntu Linux distributions repositories, to install it run apt install iftop
To launch iftop use the -i option to specify the network interface:
In my case:
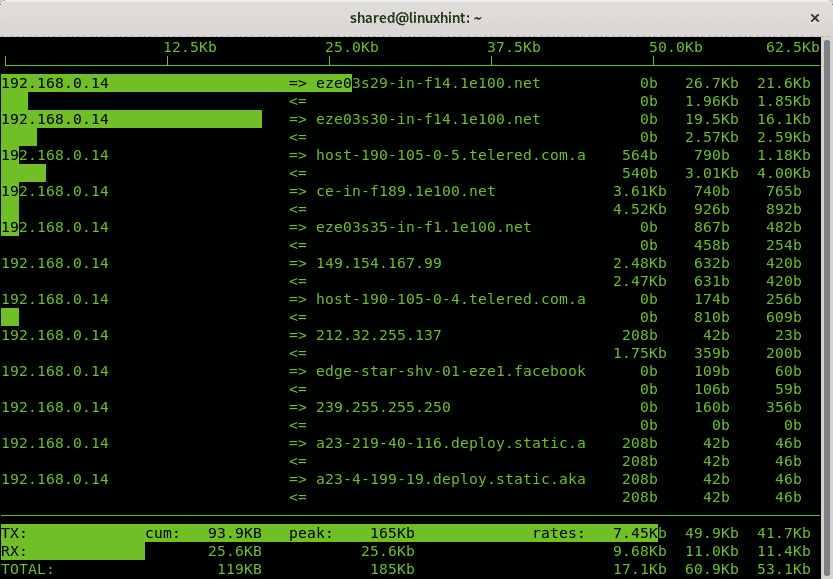
Iftop shows the transmission and reception rates, as well as incoming and ongoing speed for each established connection. At bottom you can see summarized statistics
I hope you liked this article on Linux tools for network statistics, keep following LinuxHint for more tips and updates on Linux and networking.
Related articles:
ethtool Commands and Examples
How to Monitor Network Traffic using nethogs
Top 10 Ubuntu Network Tools


