The ntop Linux tool is used to display the real-time network usage. However, ntop is currently replaced by ntopng, a free and open-source Linux tool that offers you a web-based GUI to analyze and monitor your network traffic.
With ntopng, you will access statistics, network usage, and analytic information about your network and the good thing is that it supports most Linux distros. This tutorial covers the installation and use of ntopng on Ubuntu.
Getting Started With Ntopng
-
Ntopng Installation in Ubuntu
The first thing is to add the ntopng repository.
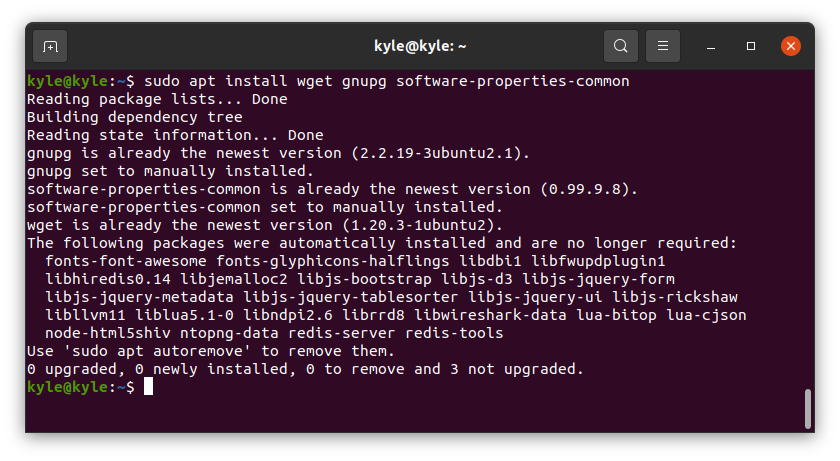
Start by installing the necessary dependencies:
1 | $ sudo apt install wget gnupg software-properties-common |
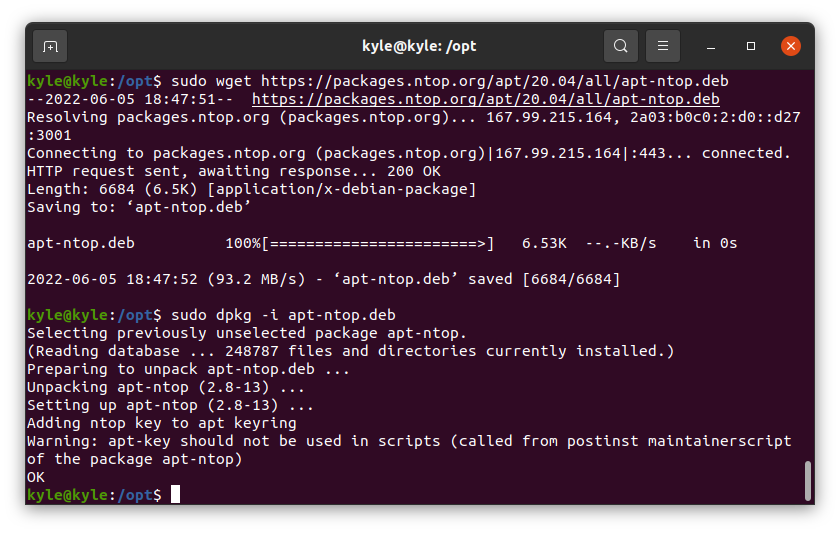
Use the following command to download and install the ntopng repository package in Ubuntu 20.04.
1 2 3 | $ wget https://packages.ntop.org/apt/20.04/all/apt-ntop.deb $ sudo dpkg -i apt-ntop.deb |
Next, update your repository.
1 | $ sudo apt update |
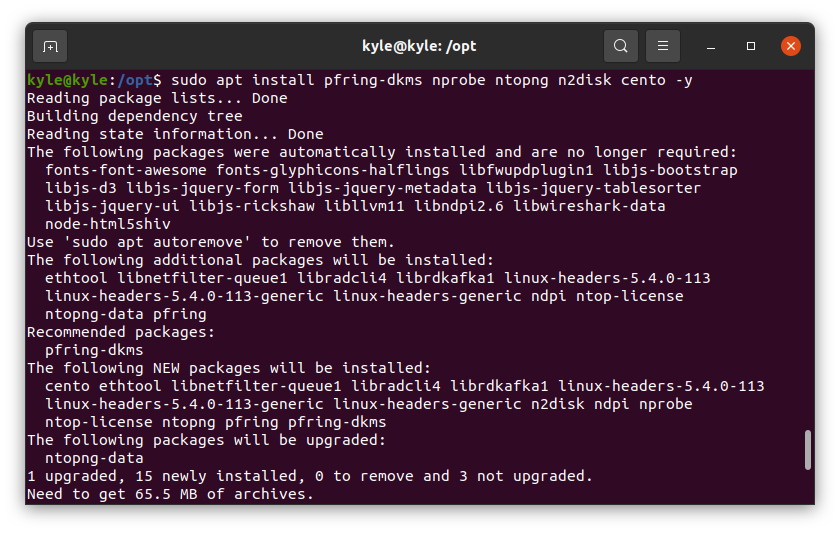
Once the repository is updated, you are now set. Run the following command which will install the ntopng and other required packages:
1 | $ sudo apt install pfring-dkms nprobe ntopng n2disk cento -y |
-
Configuring Ntopng
Once the installation part is complete, you must configure the ntopng on which port, IP, and network interface to use. As we noted earlier, ntopng uses a web-based interface and you must configure how it will access your local browser.
To make any configurations, you need to open the ntopng.conf file. You can open it with nano editor using the following path:
1 | $ sudo nano /etc/ntopng/ntopng.conf |
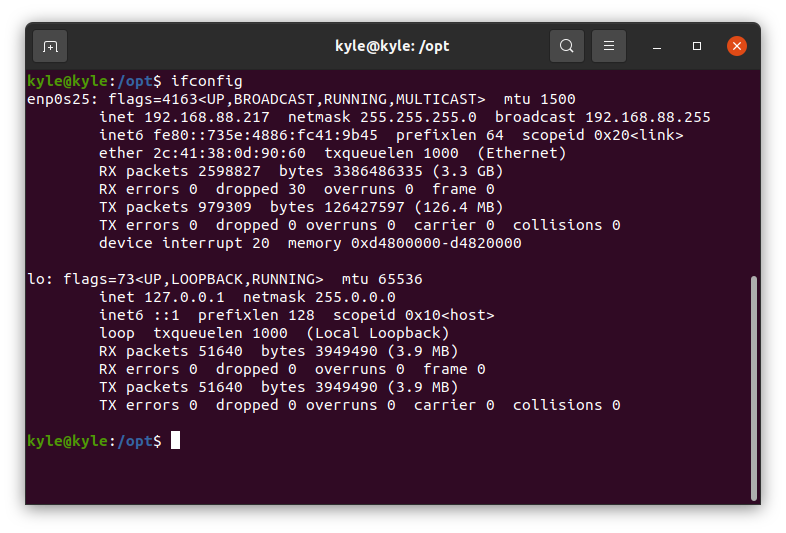
The first configuration involves determining which network interface you are using. There are two ways you can check this. The first is by using the ifconfig.
Type the command on your terminal, and it will display which interface your network is using:
In our case, our interface is enp0s25. Yours may be different, so make sure to change it appropriately.
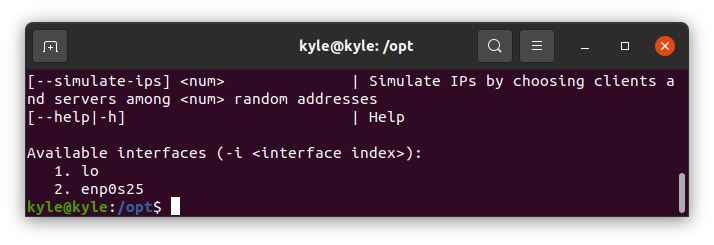
The next method is using the ntopng -h command. It displays the available network interfaces at the bottom of the file.
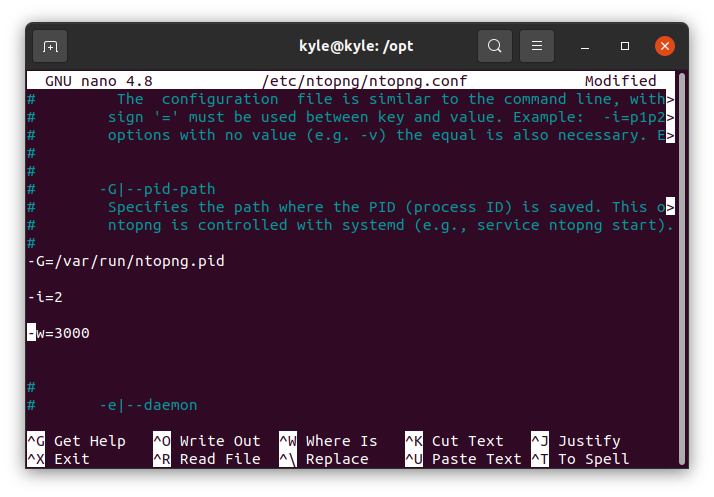
Now that you know which interfaces you have, we need to define which interface you want to monitor. To set the interface to use, add the -i=2. In this case, we are choosing to monitor the interface number 2. You can also add its name instead of the number.
Also, set the web server port in which the ntopng will open the web-based interface. Use the port 3000, -w=3000.
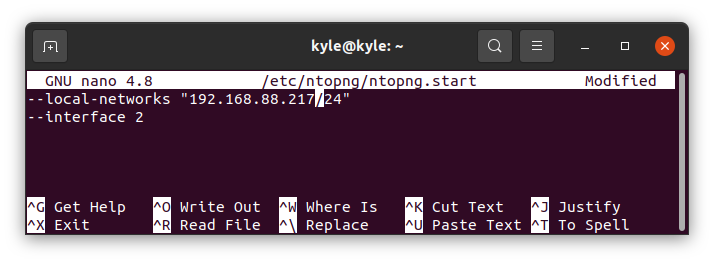
Finally, create another configuration file named ntopng.start and set your local network IP and the interface we previously used.
1 | $ sudo nano /etc/ntopng/ntopng.start |
In the following image, 192.168.88.217 is my local IP. You should replace it with your local IP displayed after running the ifconfig command. Also, in our case, our interface is number 2.
With the configuration set, it’s time to restart the ntopng services. You can do that using the following commands:
To start ntopng, use this command:
1 | $ sudo systemctl start ntopng |
To enable ntopng, start on boot time using this command:
1 | $ sudo systemctl enable ntopng |
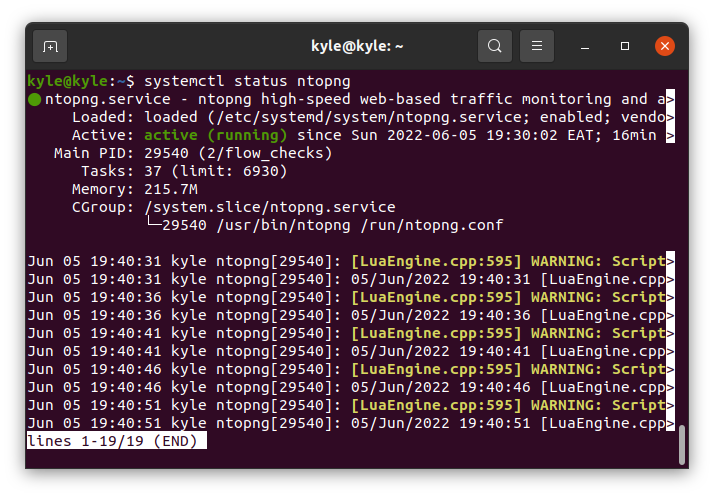
Confirm the status of ntopng using the following command:
1 | $ systemctl status ntopng |
It should show an active status, as shown in the following image:
-
Accessing Ntopng Web Interface
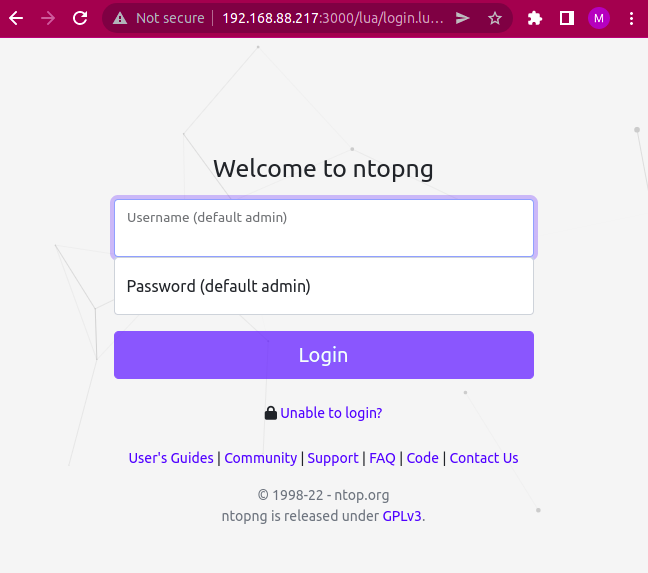
We are almost there! We set our ntopng to use the port 3000. Open your browser and enter the following URL: http://your-ip-:3000.
Your IP should be the one you set in the configuration file. Once you enter the URL, you will be greeted with a welcome page like the following:
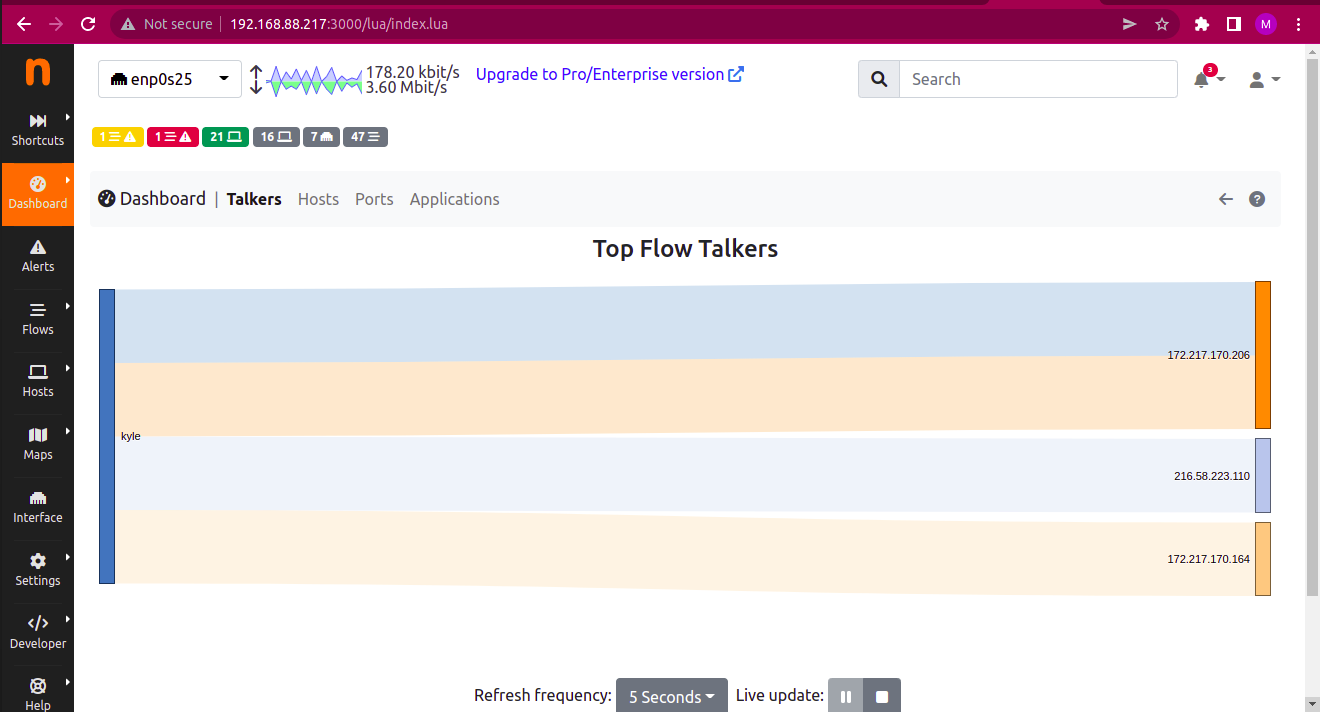
The default credentials are admin, both username and password. Click the login button and change your password. You should now see the ntopng dashboard. And you can access all the network statistics including flows, interfaces, settings, alerts, etc.
That’s it! You now have an overview of all the network traffic.
Conclusion
Ntopng is the new generation of ntop. We discussed how you can install it and configure it on your system. Moreover, we covered how to access ntopng on your browser and view the network traffic and statistics. Hopefully, you can now feel at home using ntopng.

