In this guide, we will be looking at how to install vnStat and monitor network traffic on Ubuntu OS.
Note: The procedure described here has been tested on Ubuntu 20.04 LTS. The commands have been executed on Terminal which you can open through the Ctrl+Alt+T shortcut.
Installing vnStat
VnStat is available in the default Ubuntu repositories but it is not the latest version. To install vnStat latest version, follow the below-mentioned steps:
Step 1: Update repository index
First, execute the below command to update the system repository index:
Enter the password for sudo.
Step 2: Install prerequisites
Next, you will have to install some prerequisites that can build software from source. We will need it for the compilation of vnStat. Execute this command to install the prerequisites:
Step 3: Download vnStat tar.gz package
Now from the vnStat official website, download the latest version of vnStat tar.gz package. Currently, the latest version of vnStat is 2.6, so we can download it as follows:
Step 4: Install vnStat
Once the tar.gz package is downloaded, we can install it as follows:
First, extract the tar.gz using the below command in Terminal:
Then switch to the resulting extracted directory using the below command:
Now configure it using the command below:
Then, install vnStat as follows:
$ sudo make install
Step 5: Verify Installation
To verify if vnStat has been successfully installed, execute the below command in Terminal:
The following output confirms vnStat version 2.6 has been installed.
Step 6: Enable and start vnStat service
To enable and start vnStat service, first you will need to copy vnStat service file from the vnStat extracted directory to the /etc/systemd/system/ using the below command:
Now enable vnStat service using the below command:
Then to start vnStat service, execute the below command
To verify if vnStat service is running, execute the below command:
The following output confirms vnStat service is running properly without any issues.
Monitor Network Traffic with vnStat
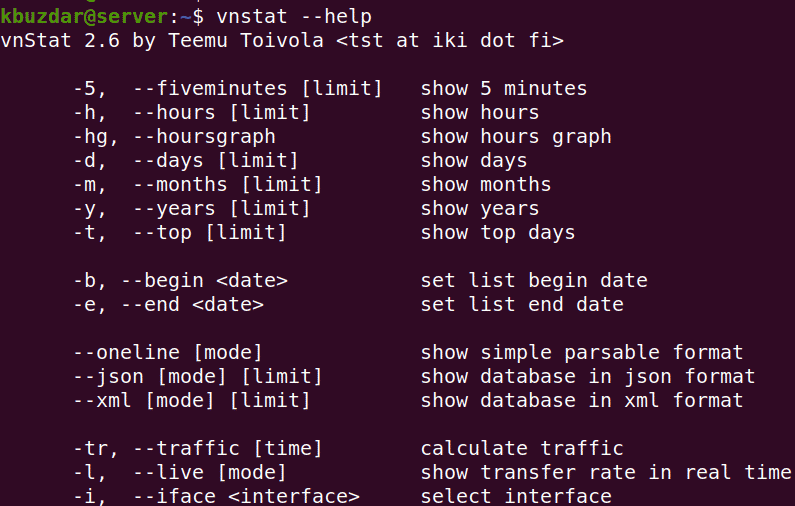
vnStat supports various options that help you to monitor traffic in different ways. You can view some of the available options by executing the below command in Terminal:
Or execute the following command to view the complete list of options:
You can also visit vnStat man page for the complete list of options.
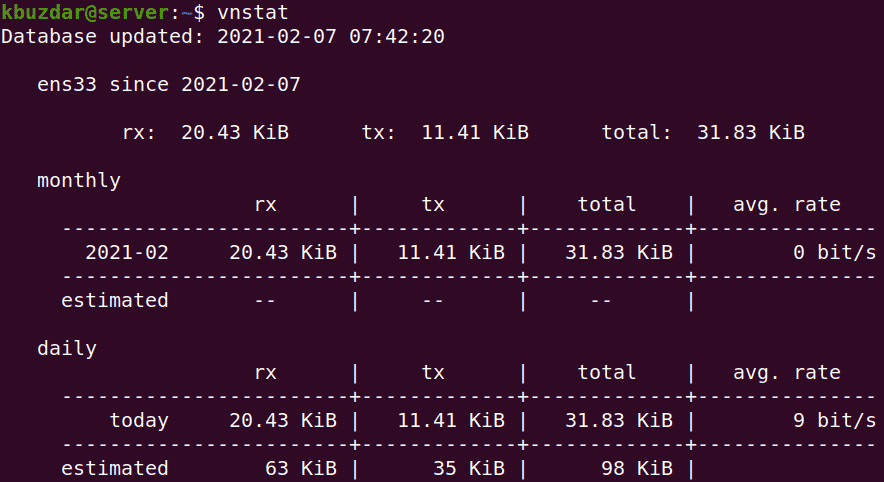
Running the vnStat command without any option prints the bandwidth usage statistics for all the available interfaces.
Here is the output of vnStat command on our system which is showing statistics of one interface as this is the only available interface on our system.
You can also monitor a specific interface by using the -i option followed by the interface name.
For instance, to monitor an interface ens33, the command would be:
You can also monitor bandwidth usage as per hourly, daily, monthly, and yearly usage using the -h, -d, -m, and -y options respectively. For example, to find the daily bandwidth usage, the command would be:
You can also get the bandwidth usage for the top traffic days. For instance, to find the top 10 bandwidth usage days, use -t option followed by the number of days:
To monitor bandwidth usage in real-time, use the -l option as follows:
If you want to remove all the statistics for a specific interface from the database and stop monitoring it, use the below command syntax:
For instance, to remove the interface ens33 from the database and stop monitoring it, the command would be:
To add this interface again for monitoring, use the below command:
After adding the interface, restart vnStat service:
vnStat is a handy tool to keep an eye on the bandwidth usage on your Linux OS. In this guide, you have learned how to install and use this tool on Ubuntu 20.04 LTS for monitoring the traffic on network interfaces.


