grok_exporter uses regular expressions for parsing different data from log files. The log files are matches line by line using a regular expression, and the matched data is stored in different variables. Then, the data of these variables are exported via grok_exporter.
Once you add the grok_exporter server to Prometheus as a target, Prometheus can monitor the desired log files via grok_exporter.
In this article, I will show you how to install grok_exporter on Linux (Ubuntu 20.04 LTS in my case), generate dummy log files, configure grok_exporter to monitor the dummy log file, and monitor the dummy log file using Prometheus. So, let’s get started.
Table of Contents:
- Things You Will Need
- Downloading and Installing grok_exporter
- Generating a Dummy Log File with fakedata
- Configuring grok_exporter
- Adding grok_exporter to Prometheus
- Scraping Metrics from grok_exporter with Prometheus
- Where to Go Next?
- Conclusion
- References
Things You Will Need:
You must have Prometheus installed on your computer to be able to monitor log files with Prometheus.
If you need any assistance on installing Prometheus on your computer, read the article How to Install Prometheus on Ubuntu 20.04 LTS.
Downloading and Installing grok_exporter:
In this section, I will show you how to download and install grok_exporter on your computer.
First, navigate to the ~/Downloads directory as follows:
Download the latest version of the grok_exporter archive with the following command:
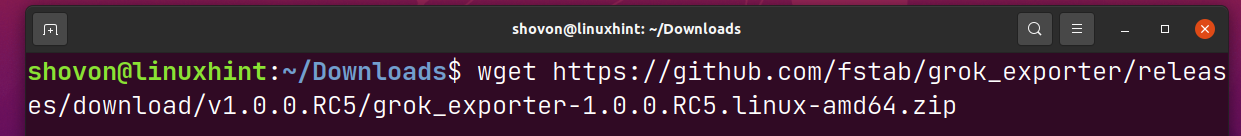
grok_exporter archive is being downloaded. It may take a while to complete.
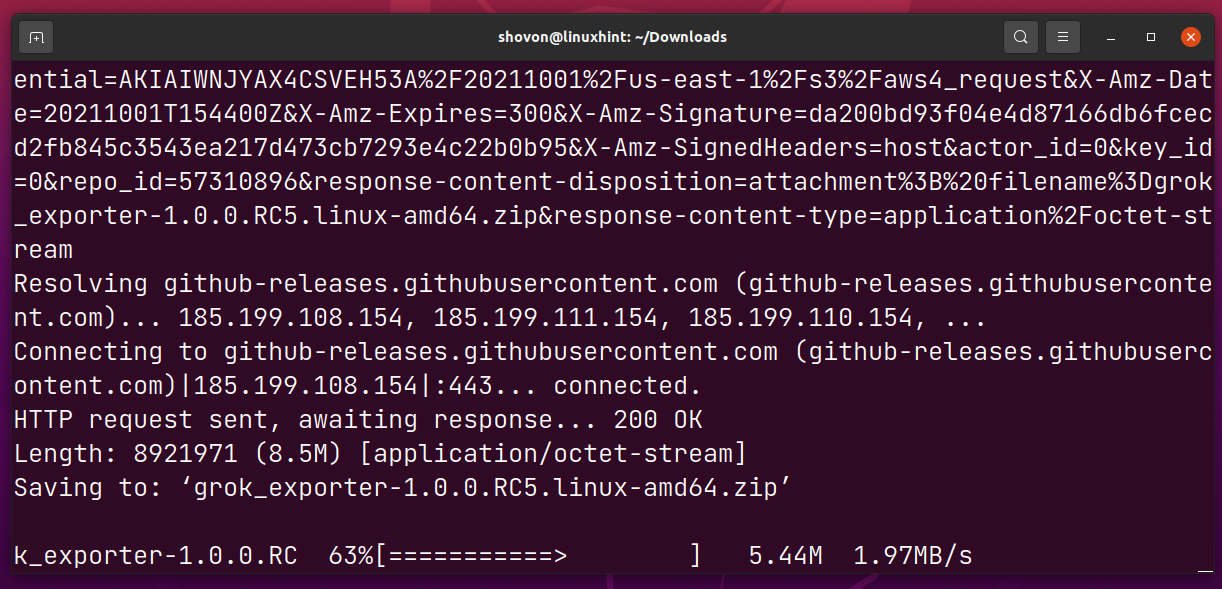
At this point, the grok_exporter archive should be downloaded.
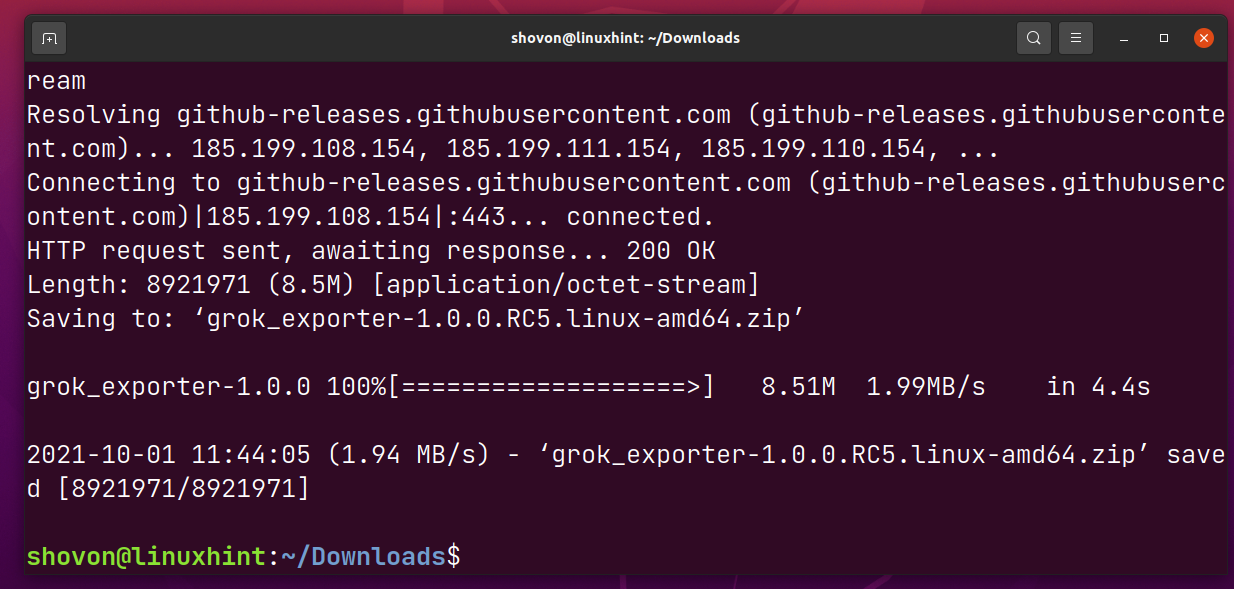
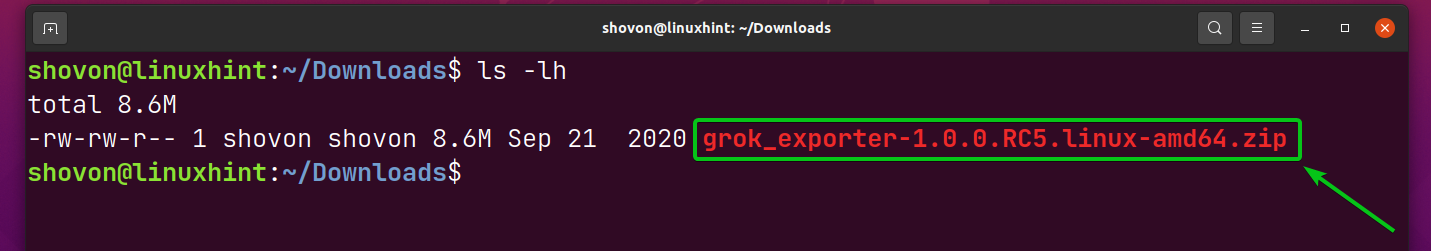
Once the grok_exporter archive is downloaded, you should find a new file grok_exporter-1.0.0.RC5.linux-amd64.zip in the ~/Downloads directory as marked in the screenshot below.
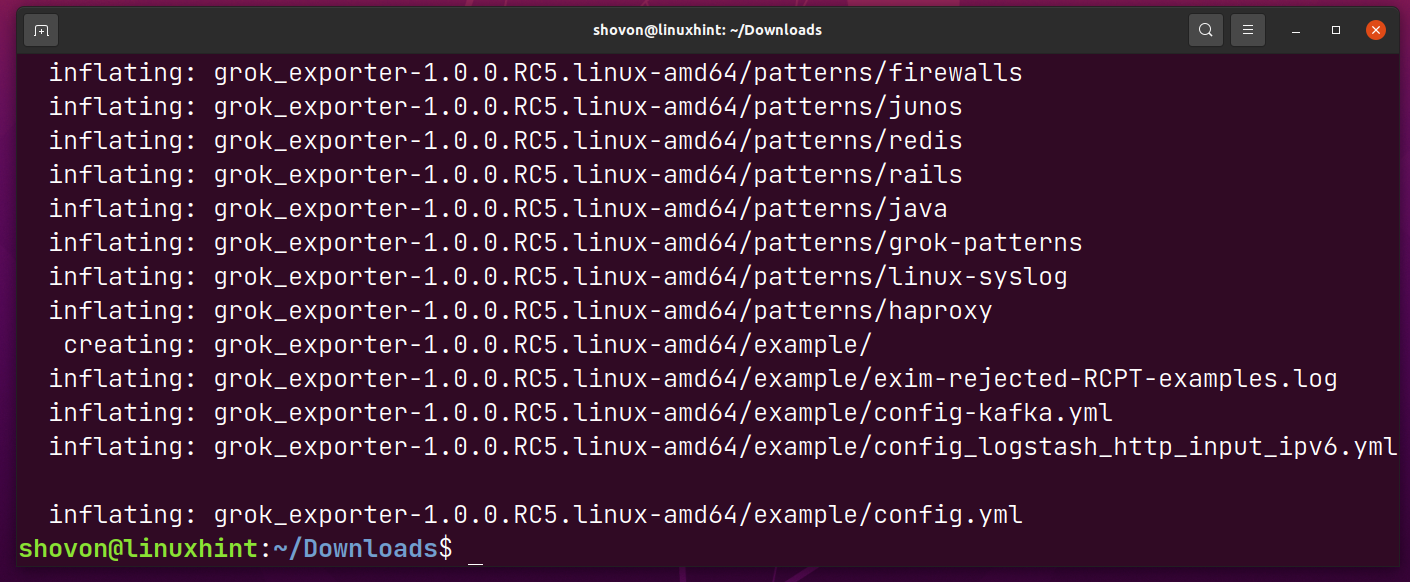
Extract the grok_exporter archive grok_exporter-1.0.0.RC5.linux-amd64.zip with the following command:

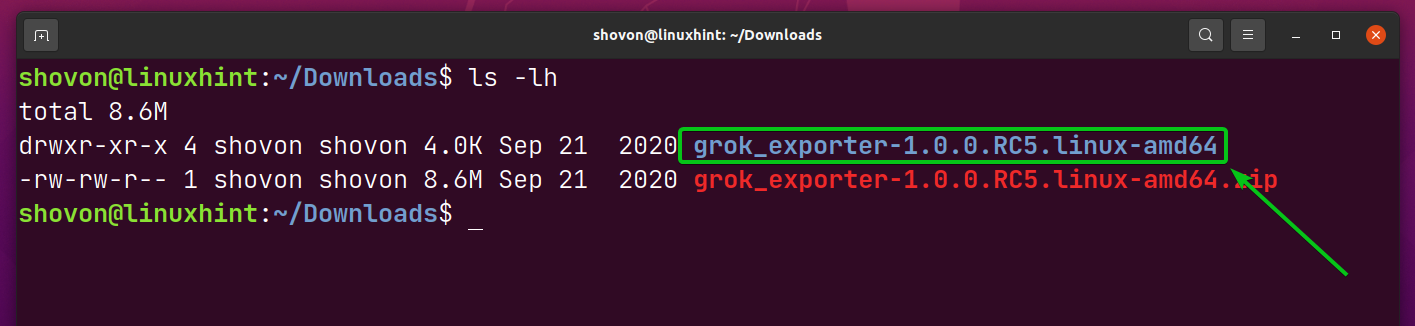
The grok_exporter archive should be extracted.
A new directory grok_exporter-1.0.0.RC5.linux-amd64/ should be created in the ~/Downloads directory.
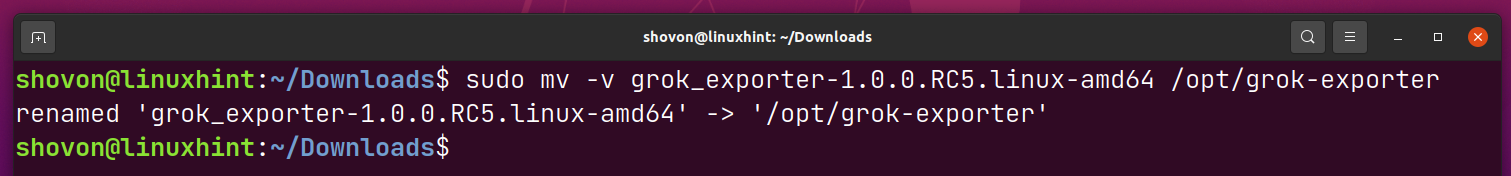
Now, rename the grok_exporter-1.0.0.RC5.linux-amd64/ directory to grok-exporter/ and move it in the /opt directory as follows:
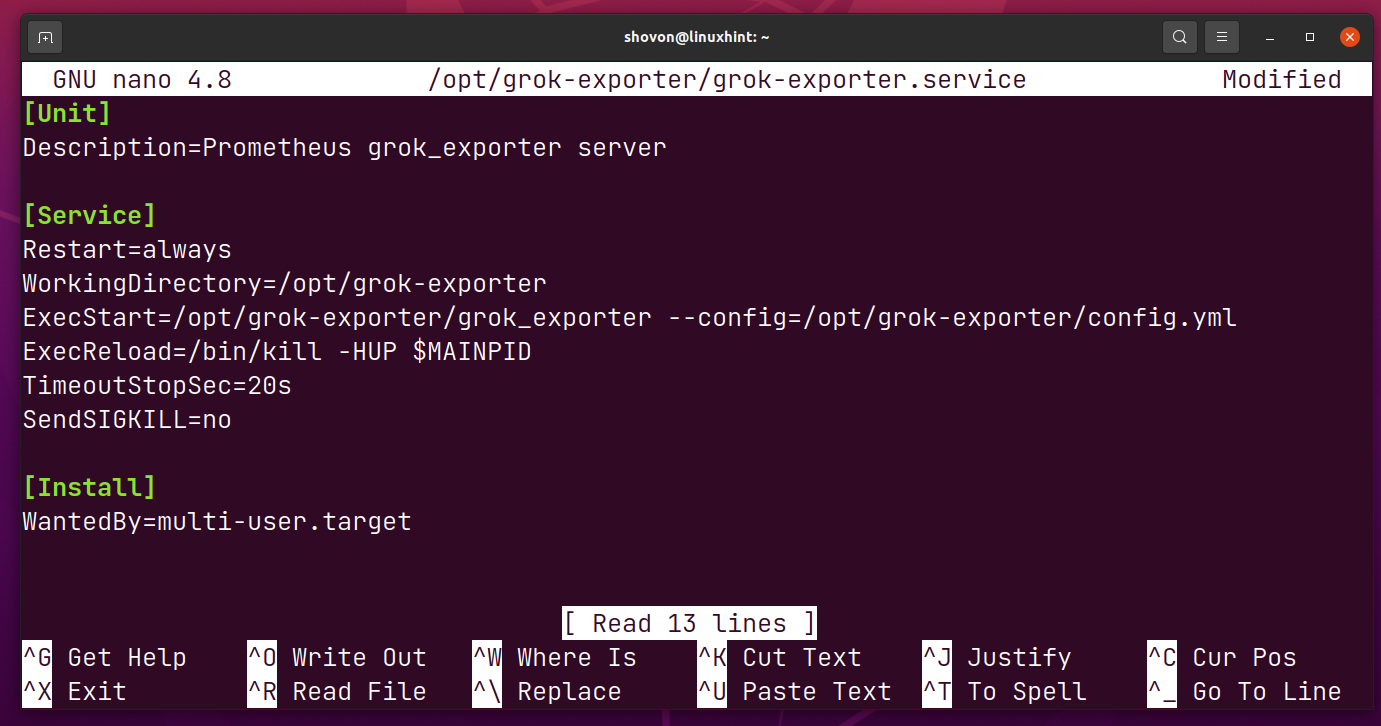
Now, create a systemd service file grok-exporter.service in the /opt/grok-exporter directory as follows:

Type in the following lines in the grok-exporter.service file.
Description=Prometheus grok_exporter server
[Service]
Restart=always
WorkingDirectory=/opt/grok-exporter
ExecStart=/opt/grok-exporter/grok_exporter --config=/opt/grok-exporter/config.yml
ExecReload=/bin/kill -HUP $MAINPID
TimeoutStopSec=20s
SendSIGKILL=no
[Install]
WantedBy=multi-user.target
Once you’re done, press <Ctrl> + X followed by Y and <Enter> to save the grok-exporter.service file.
To install the grok-exporter.service systemd service file on your computer, create a symbolic link of the /opt/grok-exporter/grok-exporter.service file in the /etc/systemd/system directory as follows:

Copy the config.yml file from the /opt/grok-exporter/example directory to the /opt/grok-exporter directory as follows:
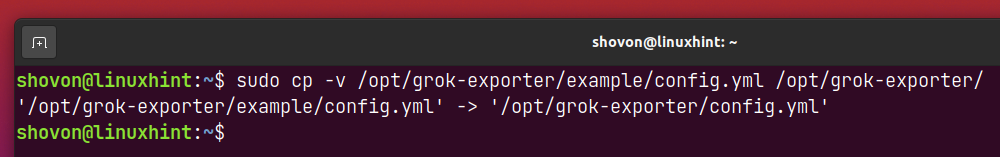
NOTE: The config.yml file is used to configure grok_exporter. The example (default) config.yml file is good for testing if grok_exporter is working. I will show you how to configure grok_exporter in a later section of this article.
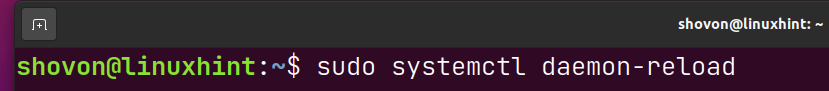
For the systemd changes to take effect, run the following command:
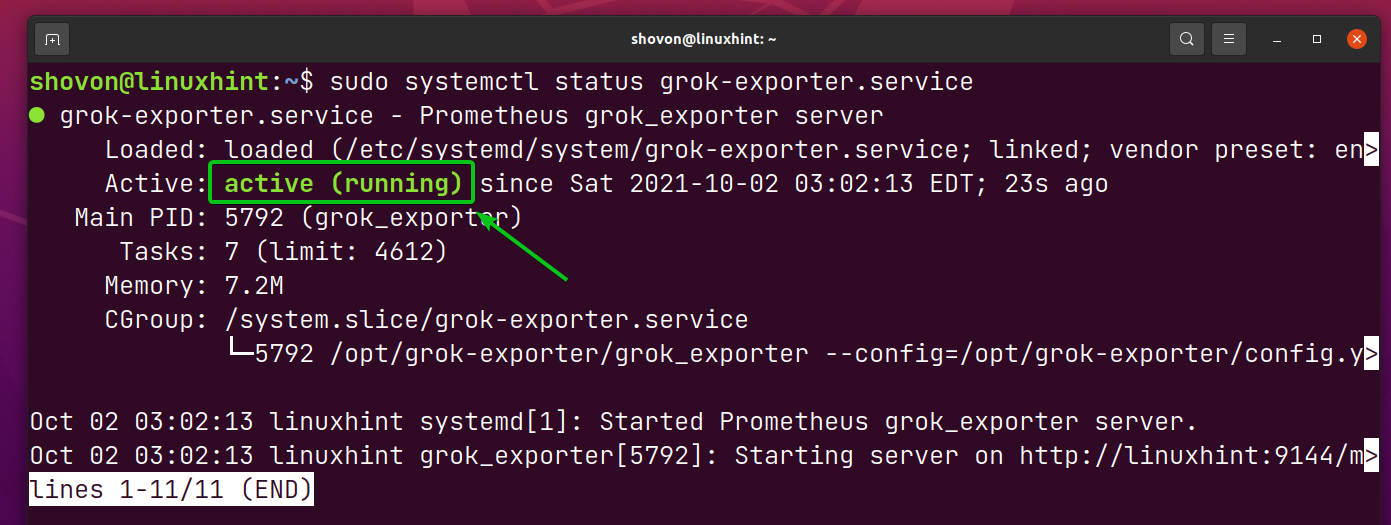
Now, start the grok-exporter systemd service with the following command:
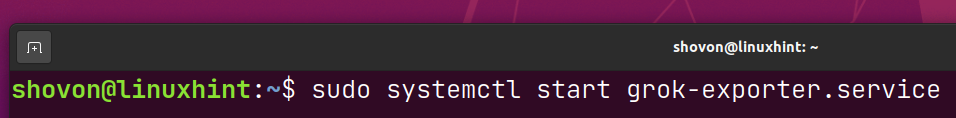
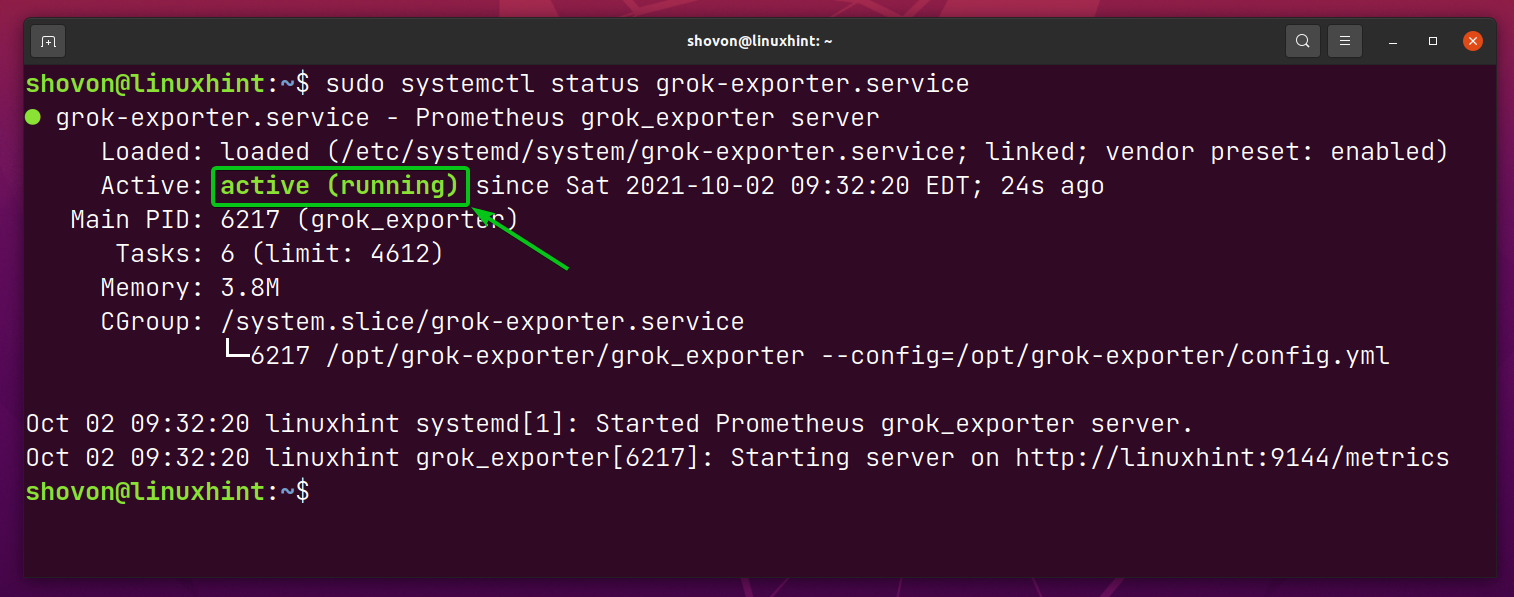
The grok-exporter systemd service should be active/running, as you can see in the screenshot below. It means grok_exporter is running just fine.
Generating a Dummy Log File with fakedata:
To generate fake log files, I will use lucapette/fakedata in this article. There are many other tools that you can use to generate fake log files. You may use any of them if you like.
First, navigate to the ~/Downloads directory as follows:

To download fakedata, run the following command:

fakedata archive should be downloaded.
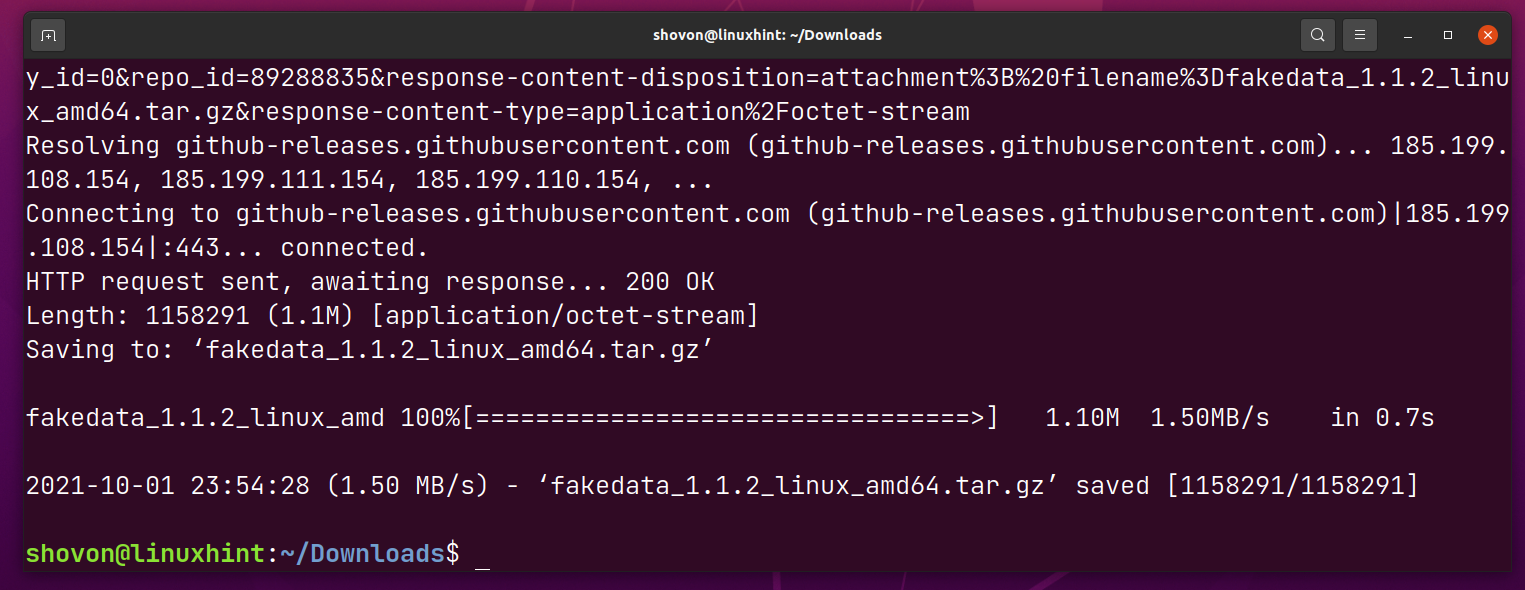
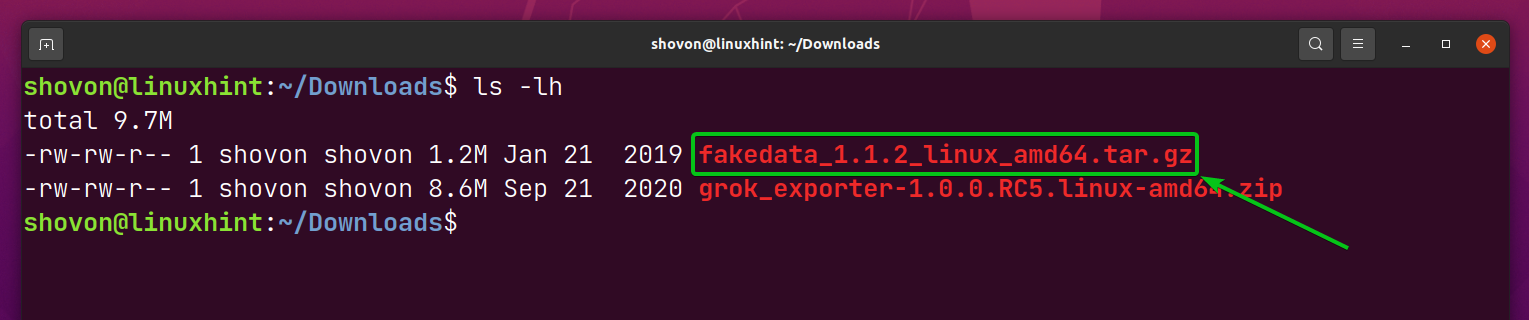
Once the fakedata archive is downloaded, you should see a new fakedata_1.1.2_linux_amd64.tar.gz in the ~/Downloads directory.
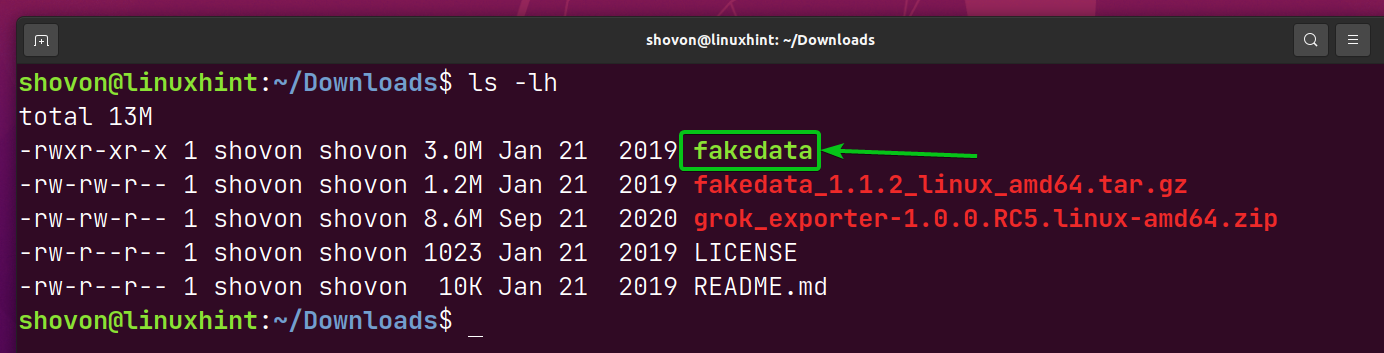
Extract the fakedata archive fakedata_1.1.2_linux_amd64.tar.gz with the following command:

You should find a new executable fakedata in the ~/Downloads directory as marked in the screenshot below.
Move the fakedata binary to /usr/local/bin directory as follows:
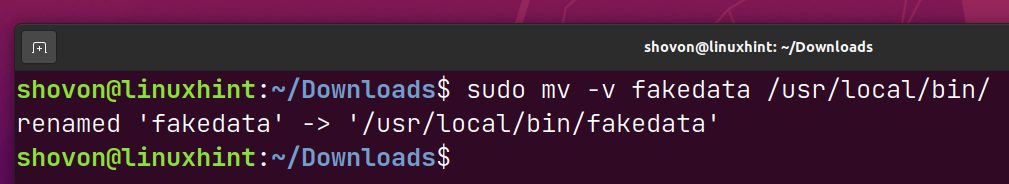
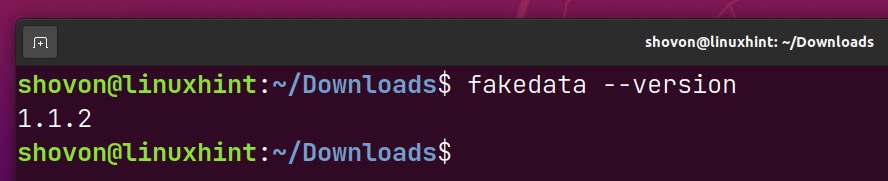
Now, you should be able to access fakedata from the command line.
Create a new shell script hello-http in the /usr/local/bin directory as follows:
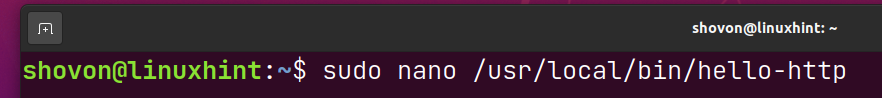
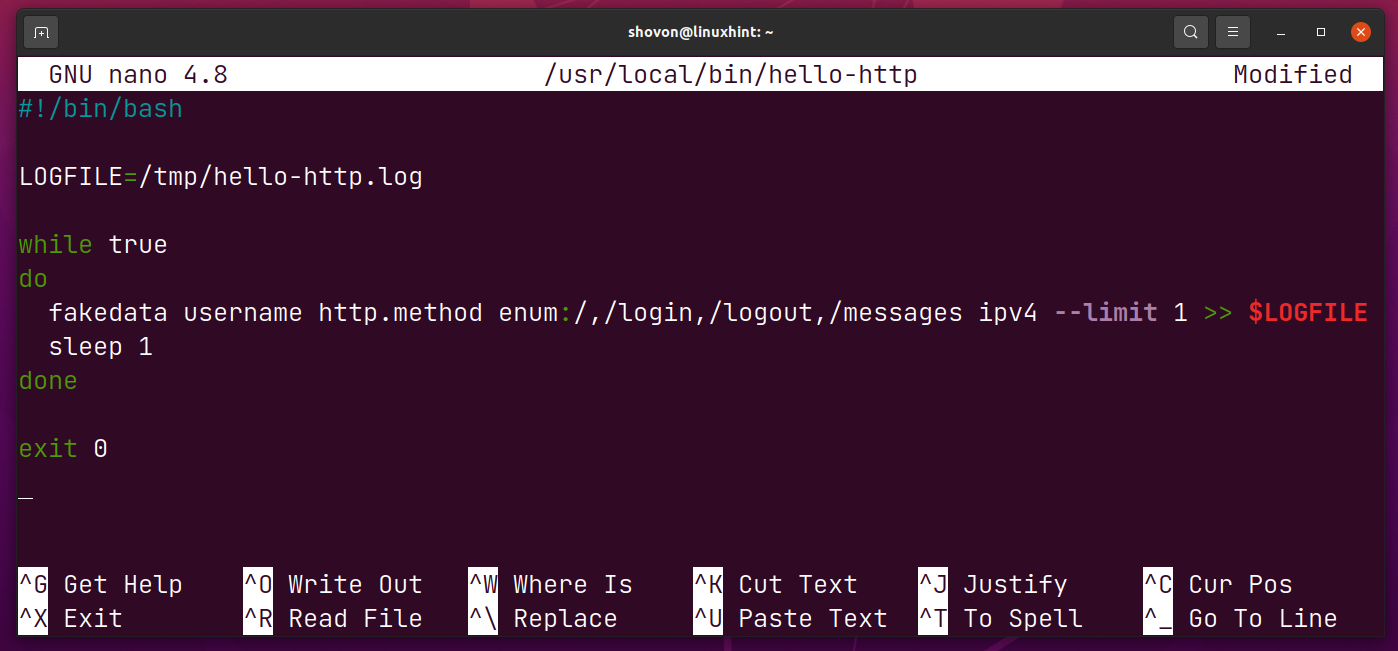
Type in the following lines of codes in the hello-http script.
LOGFILE=/tmp/hello-http.log
while true
do
fakedata username http.method enum:/,/login,/logout,/messages ipv4 --limit 1 >> $LOGFILE
sleep 1
done
exit 0
Once you’re done, press <Ctrl> + X followed by Y and <Enter> to save the hello-http script.
Add execute permission to the shell script /usr/local/bin/hello-http as follows:
To test the hello-http script, run it as follows:
A log file /tmp/hello-http.log should be generated. A new entry should be added to the log file every second.
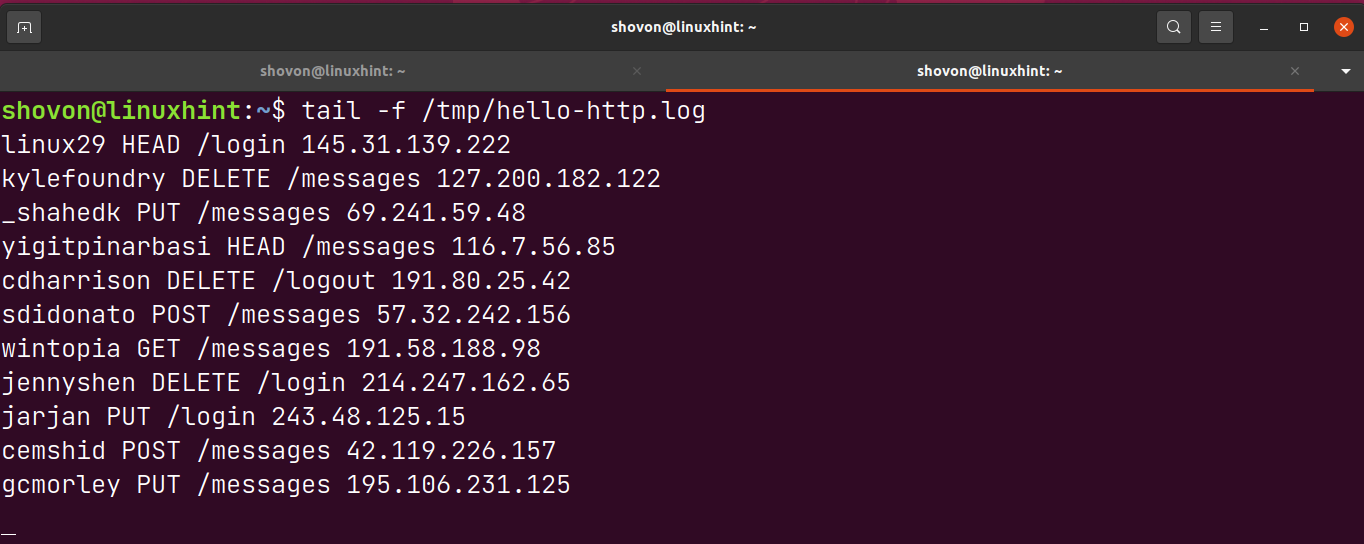
Each line of the /tmp/hello-http.log file should be in the following format,
<username> <http-method> <http-path> <ip-address>
Configuring grok_exporter:
In this section, I will show you how to configure grok_exporter to monitor the generated log file /tmp/hello-http.log.
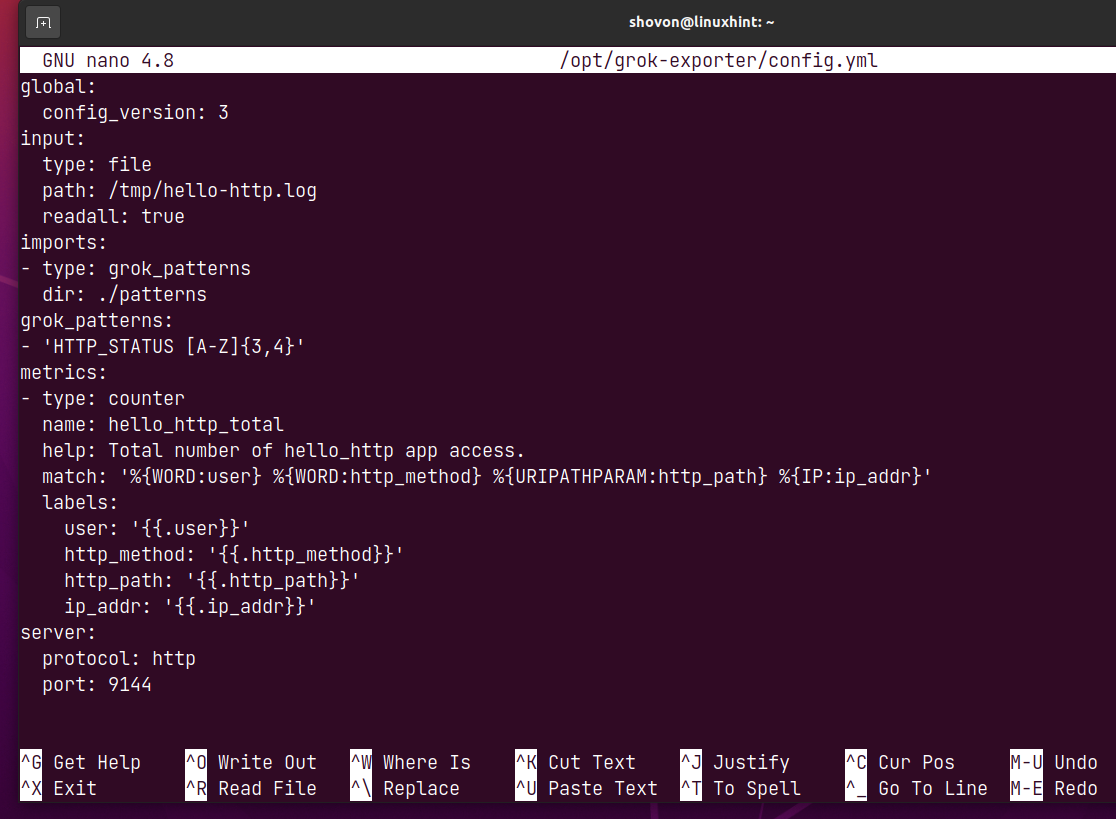
Open the grok_exporter configuration file /opt/grok-exporter/config.yml with the nano text editor as follows:
The default configuration file should look as follows.
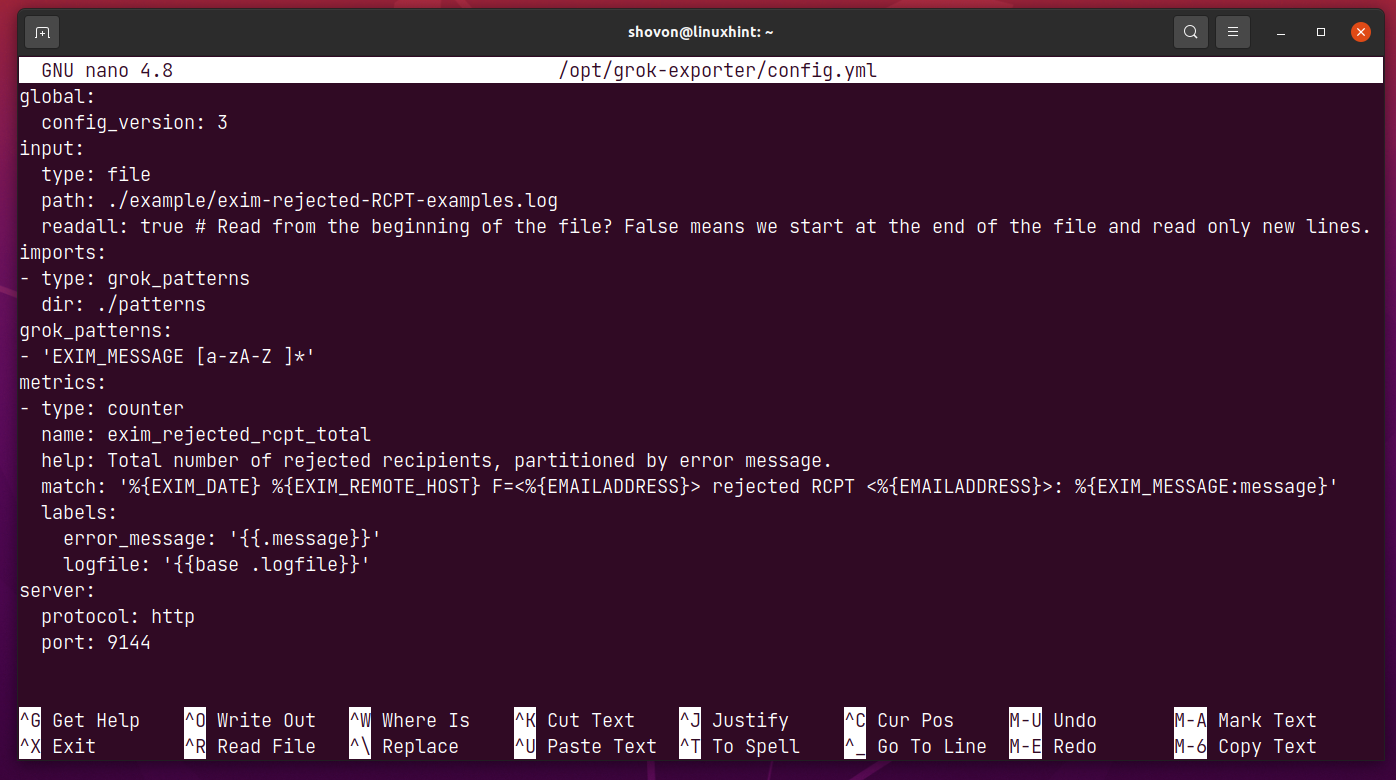
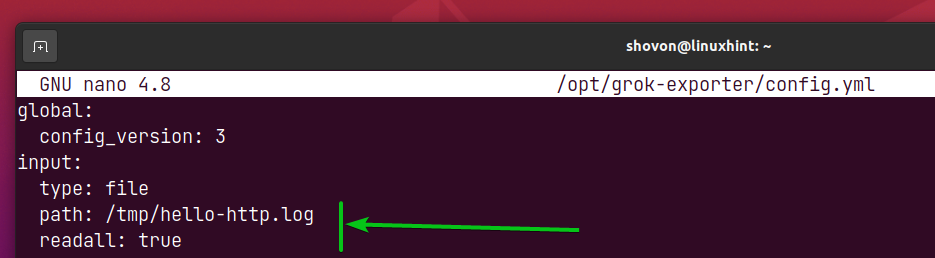
In the input section, you specify the path of the log file that you want to monitor.
In this case, I want to monitor the log file /tmp/hello-http.log.
readall should be true if you want to monitor the entire log file and newly added lines from the log file.
readall should be false if you want to monitor only the newly added lines from the log file.
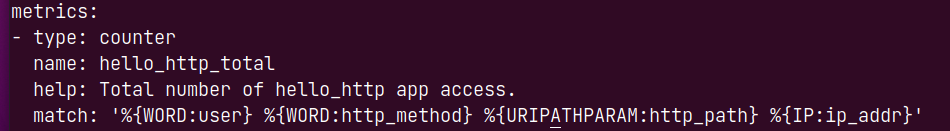
To extract data from the log file /tmp/hello-http.log, modify the metrics section of the config.yml file as follows:
Here, the metric type is counter. grok_exporter supports other Prometheus metric types as well. If you want to use a different Prometheus metric type, check the official documentation of grok_exporter. The links are given below.
grok_exporter – Counter Metric Type
grok_exporter – Gauge Metric Type
grok_exporter – Histogram Metric Type
grok_exporter – Summary Metric Type
![]()
The name of the metric will be hello_http_total.
![]()
The help property is a short description of what the metric does.
![]()
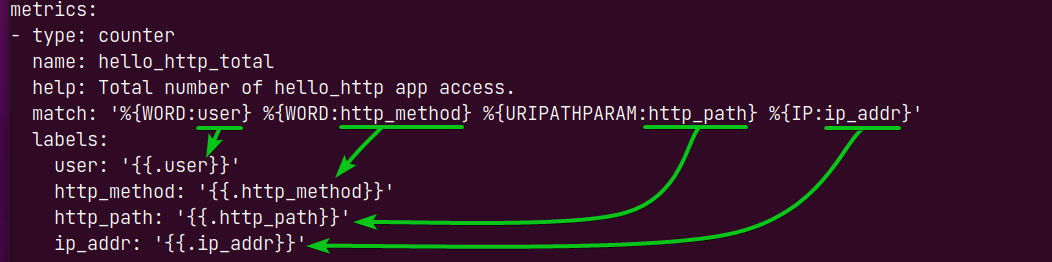
The match property is used to match different data from each log file line and store them in their respective variables.
![]()
The first column of the /tmp/hello-http.log file is the <username>. The <username> is of the pattern type WORD, and the data extracted with this type will be stored in the user variable.
![]()
In the same way, the second column is <http-method> and is also of the pattern type WORD, and the data extracted will be stored in the http_method variable.
![]()
The third column <http-path> of the log file is the URL path. It is of the pattern type URIPATHPARAM, and it will be stored in the http_path variable.
![]()
The fourth column <ip-address> of the log file is the IP address. It is of the pattern type IP, and it will be stored in the variable ip_addr.
![]()
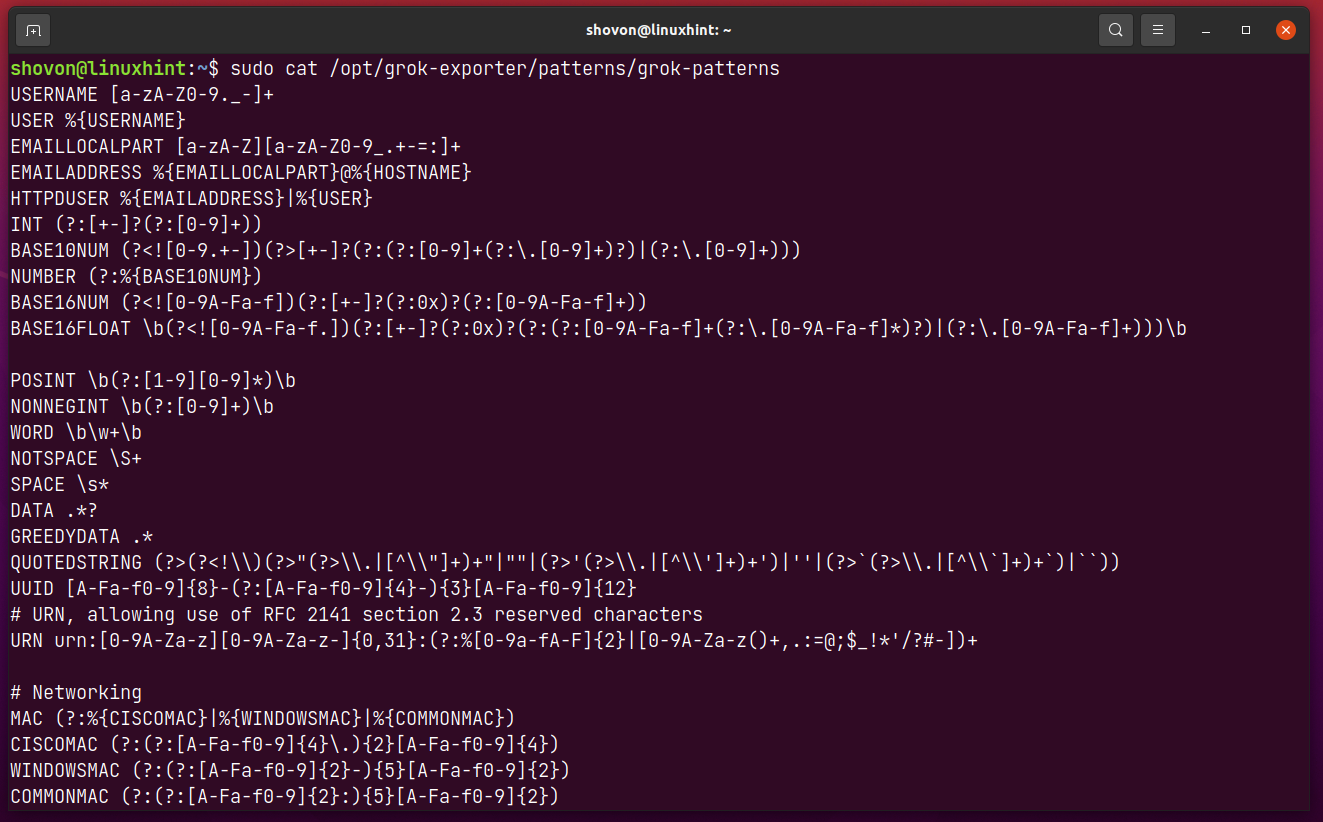
There are many other pattern types that you can use to extract data from the log file. You can find all the supported pattern types in the /opt/grok-exporter/patterns/grok-patterns file.
Once the data is extracted and stored in different variables, you can pick the variables you want to export via grok_exporter.
The variables you want to export via grok_exporter must be listed in the labels section as marked in the screenshot below.
You can also create new pattern types and match data from each log file line using the newly created pattern types.
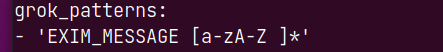
To create new pattern types, you add the pattern types in the grok_patterns section of the config.yml file.
By default, a custom pattern type EXIM_MESSAGE is defined, and it can be used to match data from log files using the regular expression [a-zA-Z ]*.
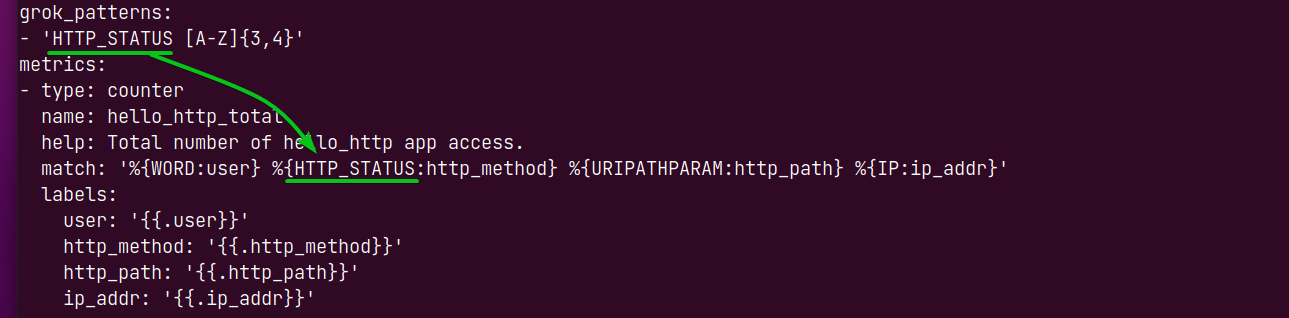
To match HTTP status (i.e., GET, POST, PUT), you can define a new pattern type HTTP_STATUS [A-Z]{3,4} and use it to match data from the log file as follows. I hope you get the idea.
The final version of the config.yml file is given in the screenshot below.
Once you’re done making changes to the config.yml file, press <Ctrl> + X followed by Y and <Enter> to save it.
For the changes to take effect, restart the grok-exporter systemd service as follows:
If everything is alright (you have not made any mistakes in the configuration file config.yml), the grok-exporter systemd service should be active/running.
Adding grok_exporter to Prometheus:
Now, you have to add grok_exporter to Prometheus as a target.
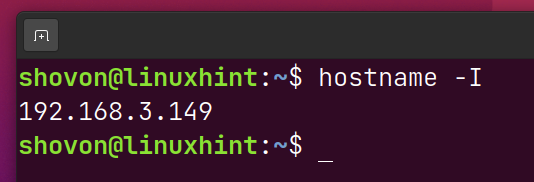
First, you need to know the IP address of the computer where you have installed grok_exporter.
In my case, the IP address is 192.168.3.149. It will be different for you. So, make sure to replace it with yours from now on.
Then, open the Prometheus configuration file prometheus.yml with the nano text editor as follows:
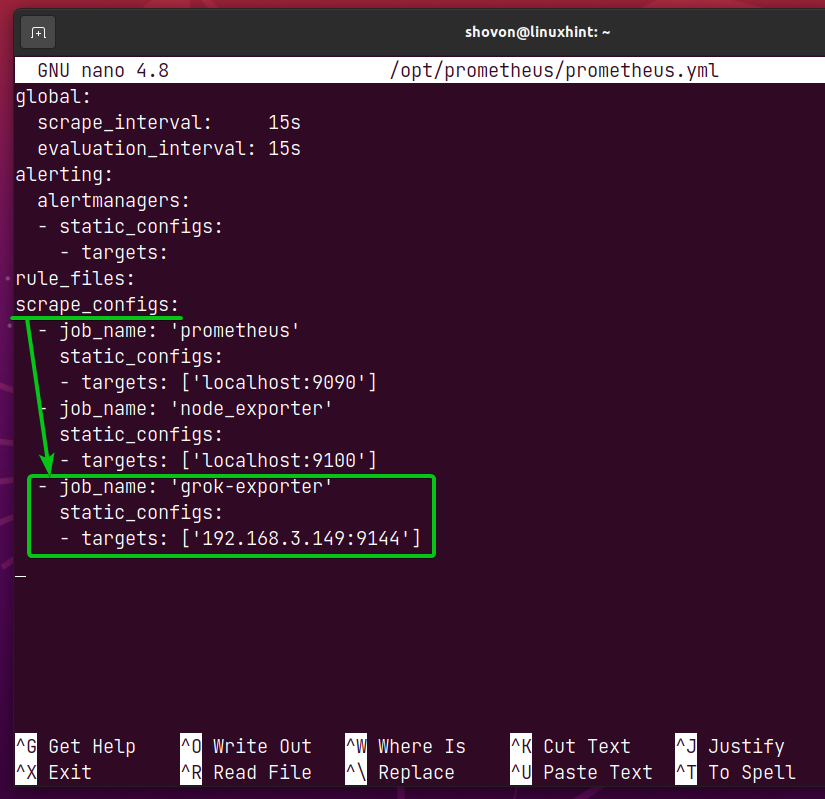
In the scrape_configs section of the prometheus.yml file, add the lines as marked in the screenshot below.
NOTE: Don’t forget to replace the target IP address of the grok-exporter job with the IP address of the computer where you have grok_exporter installed.
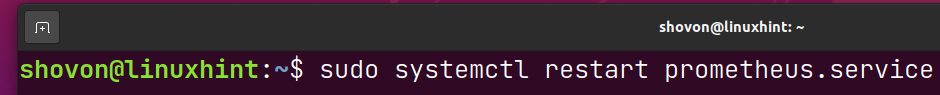
For the changes to take effect, restart the prometheus systemd service as follows:
NOTE: I have installed Prometheus on the same computer as grok_exporter. So, the IP address of the computer where I have installed Prometheus is the same as grok_exporter. In my case, it is 192.168.3.149. Make sure to replace it with yours from now on.
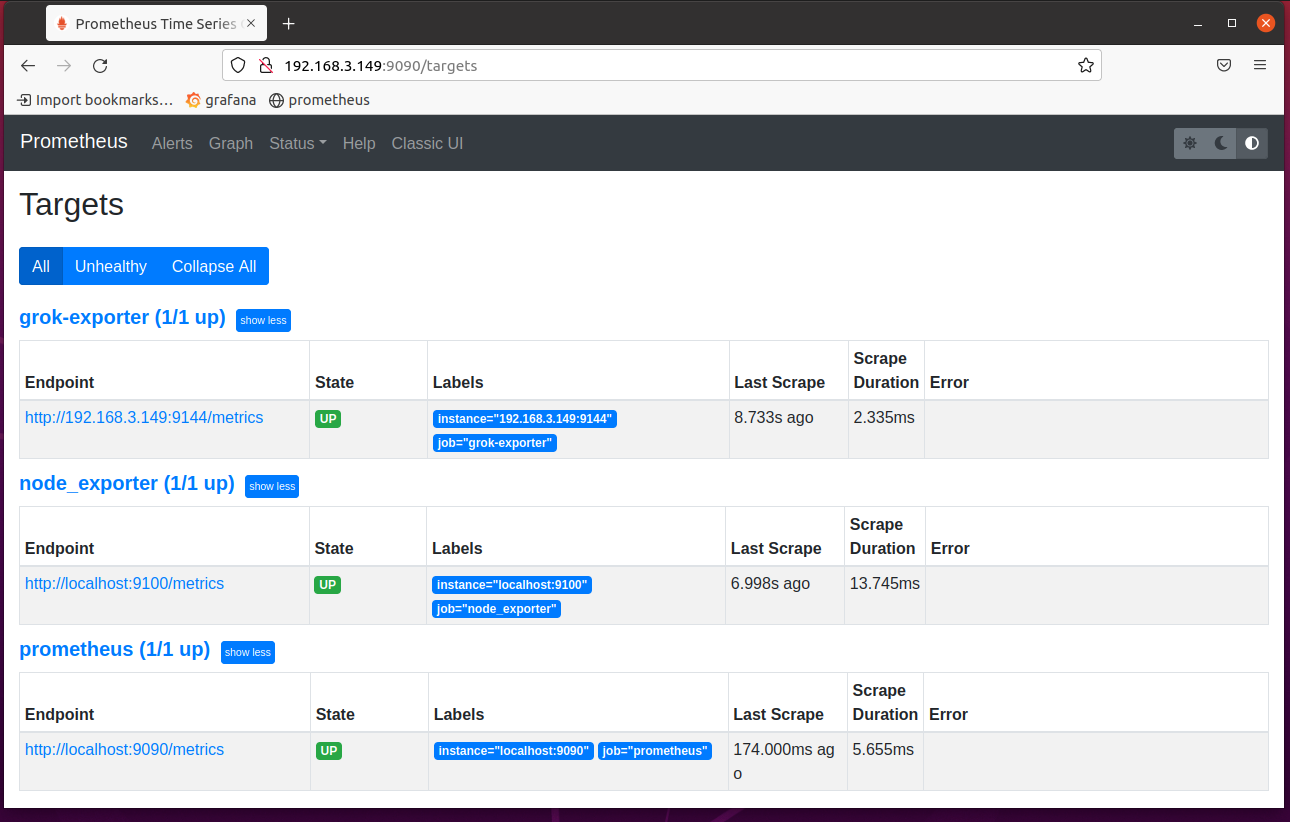
Now, visit the targets page of Prometheus at the URL http://192.168.3.149:9090/targets, and you should see that the grok-exporter target is in the UP state.
Scraping Metrics from grok_exporter with Prometheus:
Before you start scraping metrics from grok_exporter with Prometheus, start the dummy log file generator hello-http with the following command:
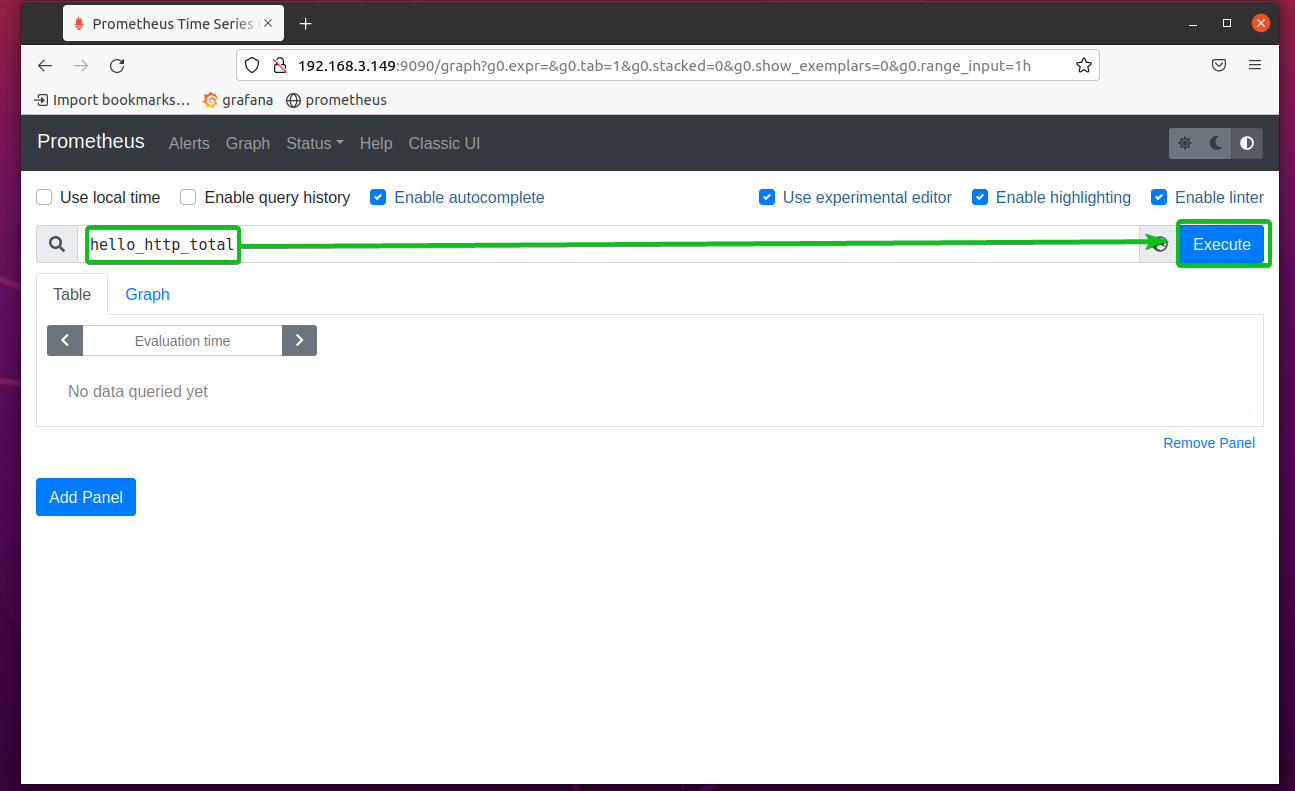
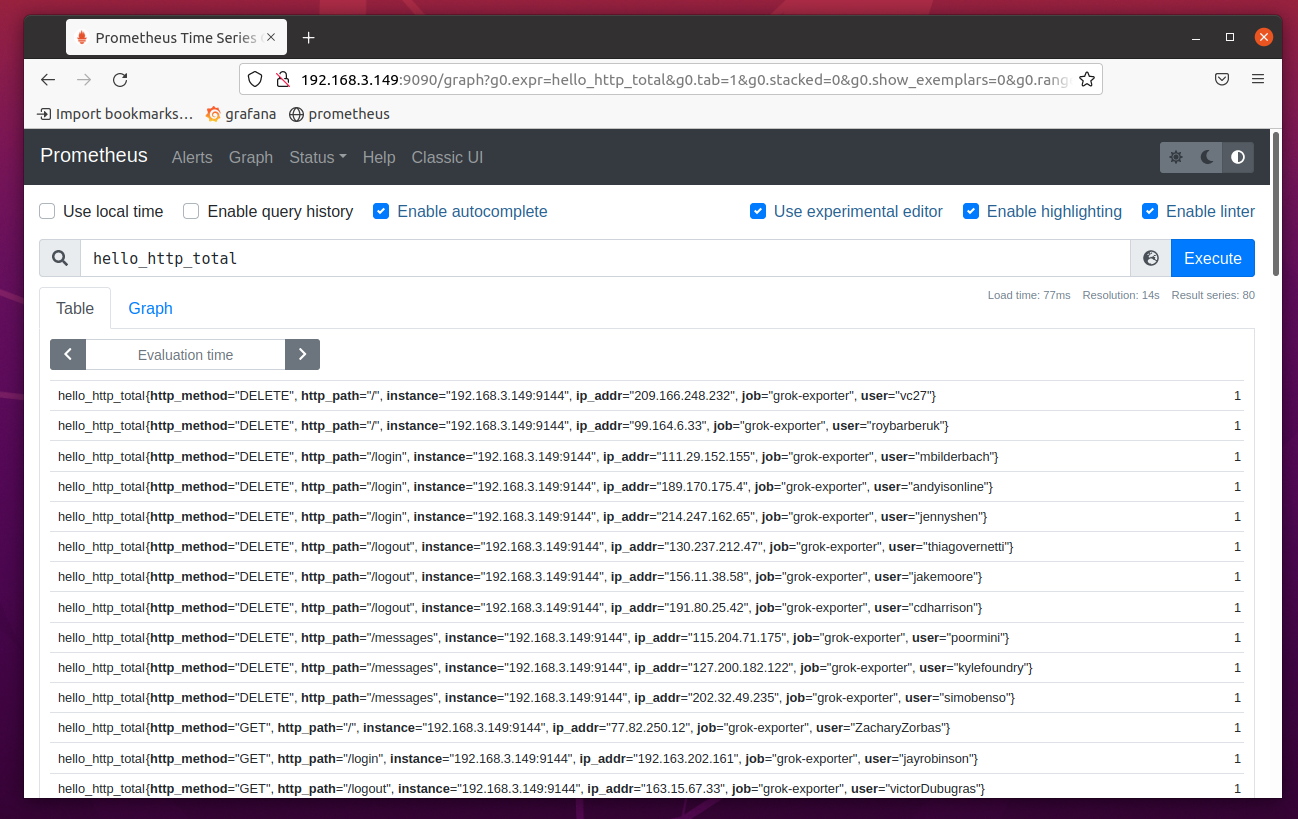
Now, visit the Prometheus Graph page at http://192.168.3.149:9090/graph and execute the expression hello_http_total.
As you can see, the data is extracted from the log file /tmp/hello-http.log. Each line of the log file is a separate entry in Prometheus.
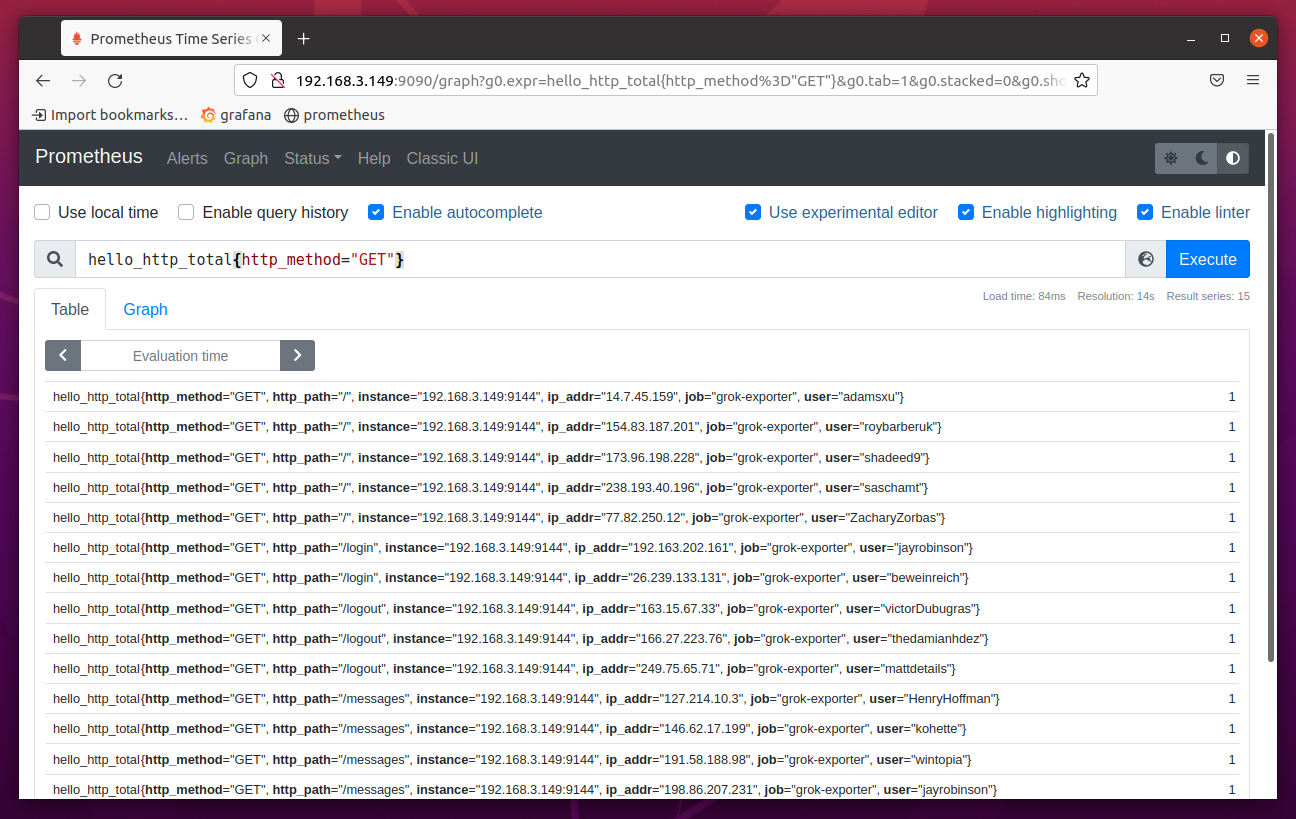
You can filter the data as well. For example, let’s say you want to list only the entries where the http_method is GET. To do that, run the expression hello_http_total{http_method=”GET”}.
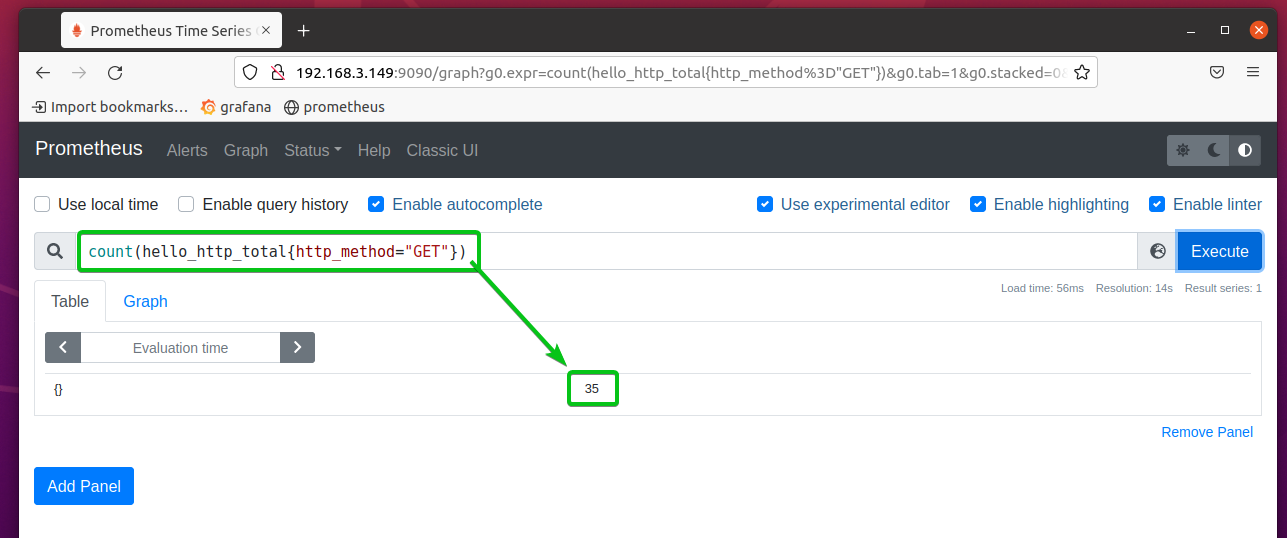
You can also count the number of entries that match certain criteria. For example, to count the number of HTTP GET requests, you can run the expression count(hello_http_total{http_method=”GET”}.
As you can see, the number of HTTP get requests is 30.
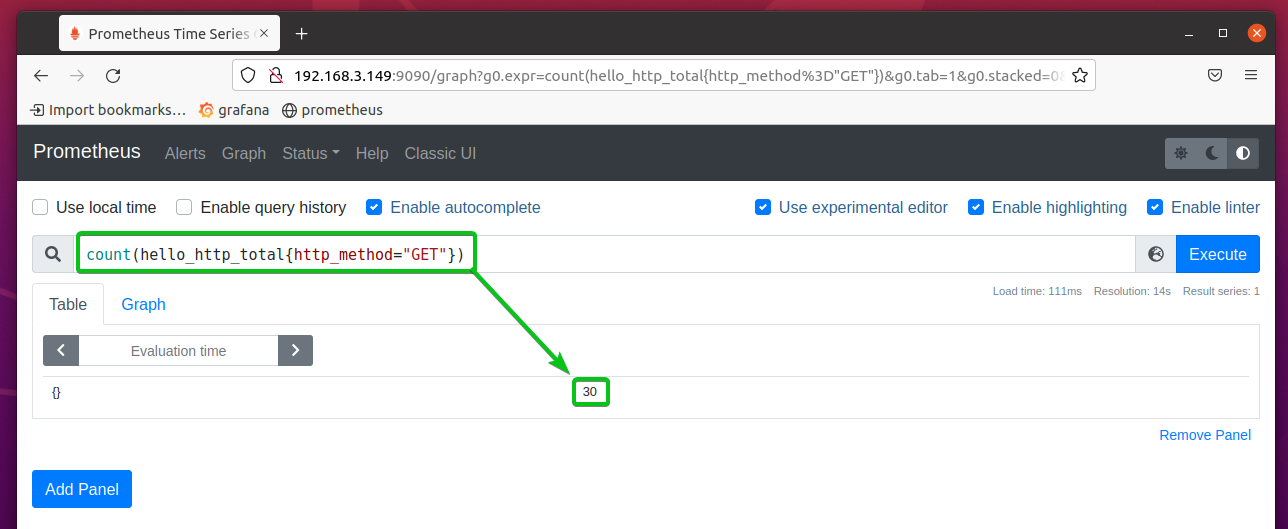
If you execute the same expression after a few seconds, the number of HTTP get requests should increase.
Where to Go Next?
To learn more about configuring grok_exporter, read the official grok_exporter configuration documentation page.
Conclusion:
In this article, I have shown you how to install grok_exporter on Ubuntu 20.04 LTS. I have also shown you how to generate dummy log files with fakedata and configure grok_exporter to monitor the generated log file. I have shown you how to add grok_exporter as a target on Prometheus and monitor log files with Prometheus as well.
References:
- fstab/grok_exporter: Export Prometheus metrics from arbitrary unstructured log data.
- lucapette/fakedata: CLI utility for fake data generation
- Grok filter plugin | Logstash Reference [7.15] | Elastic
- logstash-patterns/grok-patterns at master · hpcugent/logstash-patterns
- https://github.com/logstash-plugins/logstash-patterns-core/tree/master/patterns/ecs-v1
- Logstash: Collect, Parse, Transform Logs | Elastic
- grok_exporter/CONFIG.md at master · fstab/grok_exporter