
Installing and configuring HAProxy is the first step to harness its power as a load balancer or reverse proxy for your web applications or servers. However, you still must check the health of your servers. You can do this by having a way to monitor HAProxy. It is through monitoring HAProxy that you can assess the performance and reliability that HAProxy offers. There are different ways of monitoring HAProxy, and this post shares a detailed one that involves using the built-in feature provided with HAProxy.
Getting Started with Monitoring HAProxy
HAProxy is a popular load balancer. When you have it installed on your system, the next step is understanding how you can monitor it to ensure that it meets your performance and reliability expectations.
Besides, it’s through monitoring HAProxy that you can check for any malfunctions and avoid downtime. For instance, when monitoring HAProxy, you can check out the memory usage. If you notice any red flags, you can quickly intervene to prevent a malfunction.
There are different methods that you can use to monitor HAProxy. For this case, we will use the HAProxy stats page and the logs options. However, there are third-party tools such as Grafana and Prometheus that also offer reliable ways of monitoring HAProxy. Even the built-in options also do an excellent job as we will see in the following sections.
Method 1: Using the HAProxy Stats Page
Before we see how to monitor HAProxy, let’s do a quick installation. If you have HAProxy already installed and configured, skip this part and check where we start configuring the stats page.
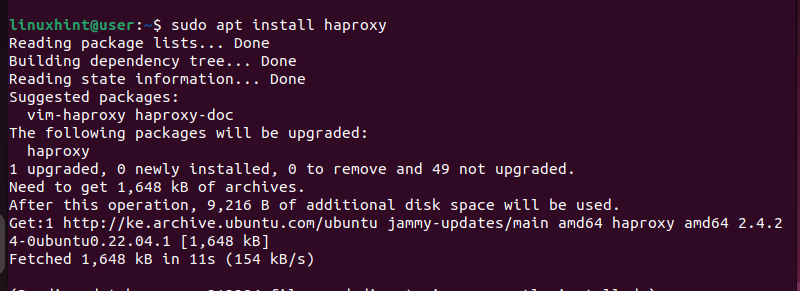
HAProxy can be quickly installed via APT with the following command:
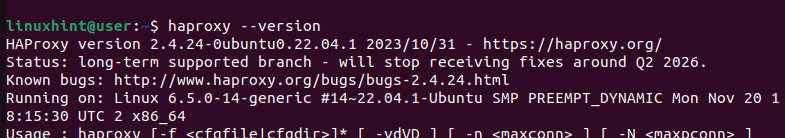
Once the installation is complete, verify that HAProxy has been installed successfully by checking its version.
The following output shows that we have HAProxy 2.4.24 installed:
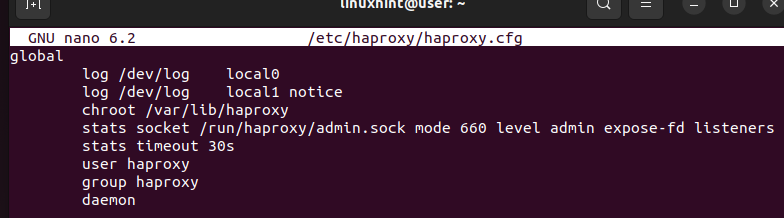
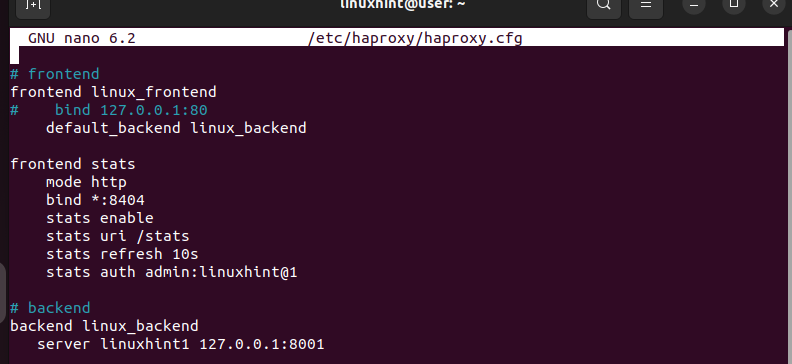
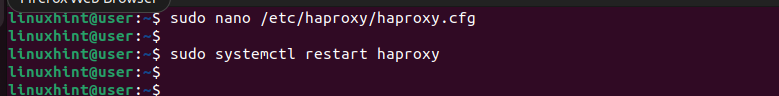
The next step is to configure HAProxy which is where we define how we want to monitor it. Open the config file using a text editor.
At the top, you have the global section. Edit it to ensure that it aligns with how you want to use HAProxy and the type of security warnings to log. For instance, we are logging the general and notice warnings:
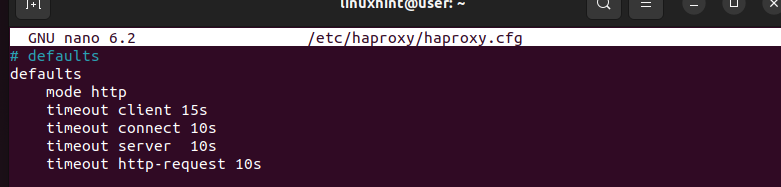
Scroll down and create a “Defaults” section where you specify the mode and the timeout for different activities. We kept our default section simple. You can copy it and paste it into your configuration file.
The last section is to define the frontend and backend. The frontend is where you specify which ports to bind for the connection and what backend to use. For the first frontend, we specify the backend. On the next frontend, we use it to create our listener for the stats page.
For the stats, specify which port to use to access the stats page. Also, specify the URL to use and optionally create the authentication username and password to restrict the access to the stats page.
Lastly, save and exit the HAProxy configuration file and then restart HAProxy.
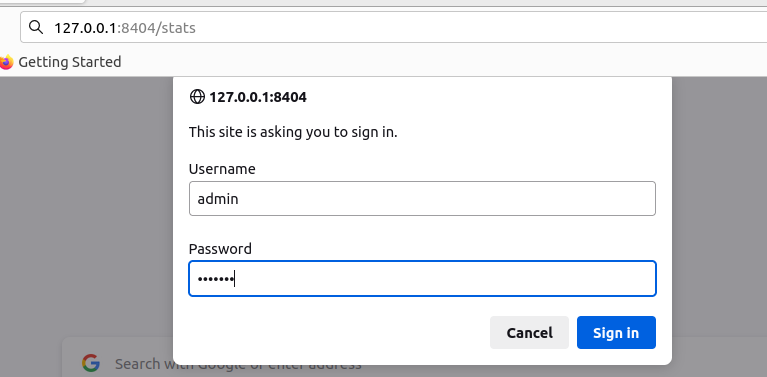
You are now ready to start monitoring HAProxy using the stats page. Open your browser and access the http://your-ip:port/stats page. For our case, the stats page is running in our localhost on port 8404 which we define in the “Frontend Stats” section of our configuration file.
Once the page loads, sign in using the username and password that you specified earlier.
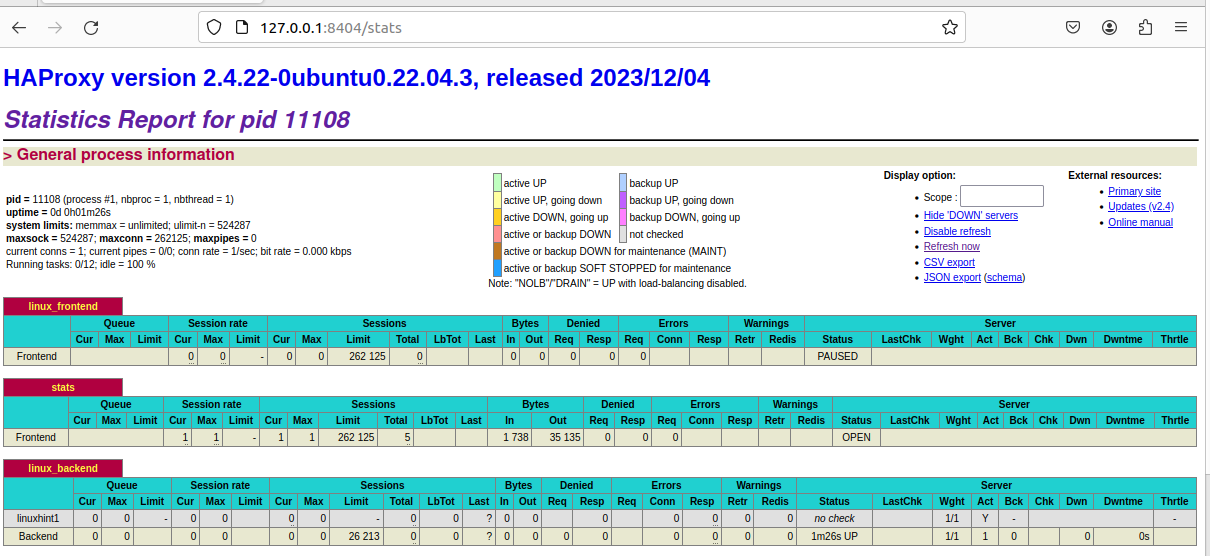
Once you sign in, the stats page will display the details about your HAProxy and how it is load-balancing your web applications. You can go through the stats page to dig deeper into different metrics to confirm the health status of your HAProxy and web applications.
Method 2: Using the Logs
Aside from using the stats page, you can also check the HAProxy logs to see any warnings that also help with monitoring it. However, this method is the least effective, but it can also help you check the health status of your web applications.
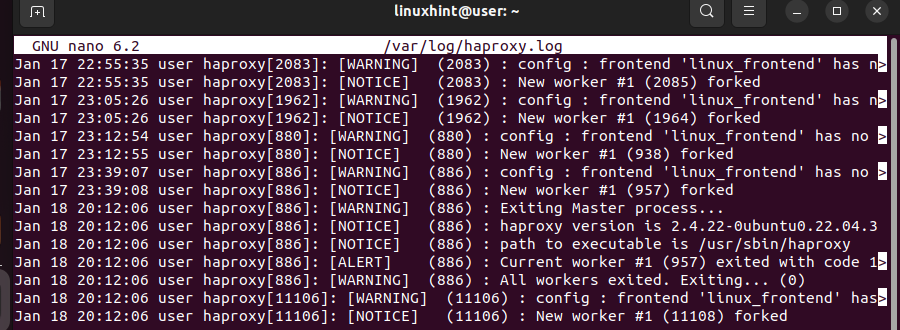
You can use a text editor such as nano to open the log file.
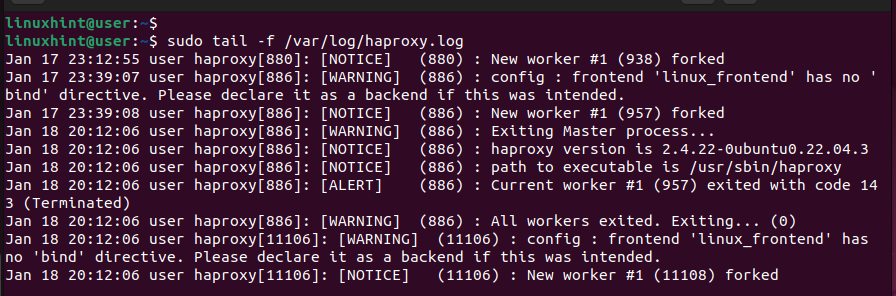
Alternatively, use the “tail” command to display the last lines in the log file in real time.
That’s how to monitor HAProxy.
Conclusion
Monitoring HAProxy is ideal for checking the health status of your web applications and checking the performance and reliability that you are getting with the load balancer. You can access the HAProxy stats page to see all the statistics or inspect the log file for warnings and other activities. Both options are detailed in this post.