This guide will illustrate how to check and monitor Elasticsearch cluster health using the health API.
Usage
To get the information about your cluster’s health, make a GET request to the health API as shown in the request below:
"cluster_name" : "55fe667810a347cebf1db500b702f968",
"status" : "yellow",
"timed_out" : false,
"number_of_nodes" : 3,
"number_of_data_nodes" : 2,
"active_primary_shards" : 109,
"active_shards" : 218,
"relocating_shards" : 0,
"initializing_shards" : 0,
"unassigned_shards" : 6,
"delayed_unassigned_shards" : 0,
"number_of_pending_tasks" : 0,
"number_of_in_flight_fetch" : 0,
"task_max_waiting_in_queue_millis" : 0,
"active_shards_percent_as_number" : 97.32142857142857
}
One entry from the result of the query above is the status. In our example above, the status of the cluster is yellow.
Elasticsearch has three main cluster health statuses:
Green – Green means that all the shards in the cluster are allocated.
Yellow – A yellow status indicates that the cluster’s primary shard is allocated, but the replicas are not allocated.
Red – Red status means that the specified shard is not allocated in the cluster.
Based on the output of the health API, you can determine which actions to take to fix your cluster’s health.
Health API Query Parameters
There are various parameters you can pass the health API endpoint. Such parameters include:
Level – Determines the level of details of the health information gets from the request. By default, this value is set to cluster but can also include: indices and shards.
Timeout – Sets the maximum time to wait for a response. Set to 30s by default. If the specified time expires before Elasticsearch sends back a response, the request fails.
wait_for_nodes – Tells the request to wait for a specific number of nodes to be available.
wait_for_status – The request will wait until the status of the cluster deviates to the one specified. For example, if set to green, the request will wait for the status to change from yellow or red to green. This can be helpful to determine if the fix you are applying to the cluster works.
Understanding the Response Body
In the previous example, we received a response of the cluster’s health in JSON format. Let us discuss what each of the entries in the response entails.
cluster_name – Shows the name of the specified Elasticsearch cluster.
Status – The health status of the cluster. Either: green, yellow, or red.
Timed_out – A Boolean true or false that describes receipt of the response within the maximum timeout value.
number_of_nodes – The total number of nodes in the specified cluster.
number_of_data_nodes – The total number of nodes dedicated to data.
active_primary_shards – the total number of active primary shards in the cluster.
active_shards – the total number of shards in the cluster. Both primary and replica shards.
relocating_shards – number of shards undergoing relocation.
initializing_shards – shards that are undergoing initialization.
unassigned_shards – total number of unallocated shards.
The above are some of the essential information from the response. You can learn more using the documentation.
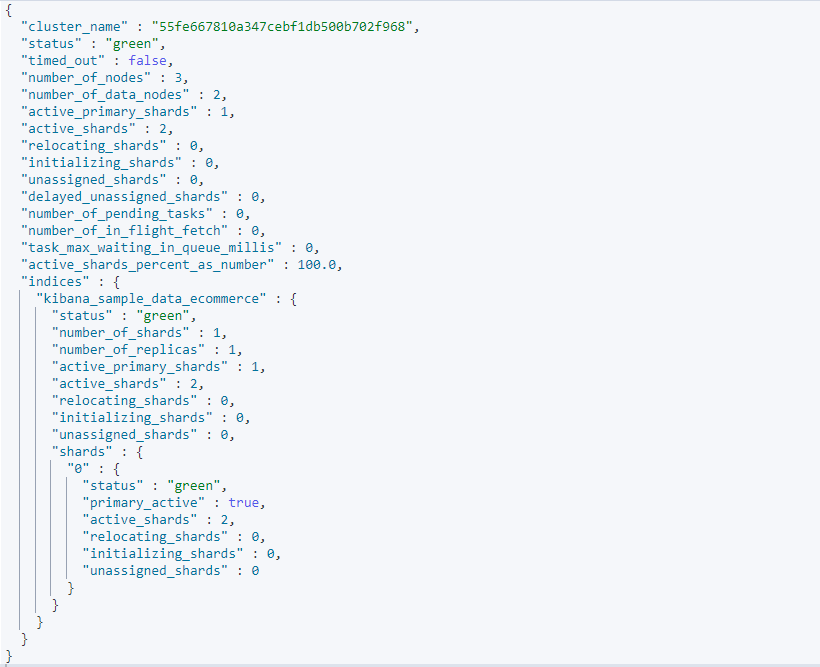
To query the information of a cluster of an index, use the query as shown below:
The above request should return a sample output similar to the one shown below:
To summarize
This article discussed how to use the Elasticsearch health API to get information about the health of a cluster. You can use the concepts taught in this guide to create an automatic python script that checks the health for a few hours and sends an email if red or yellow.
Thank you for reading!

