Common GDB Commands
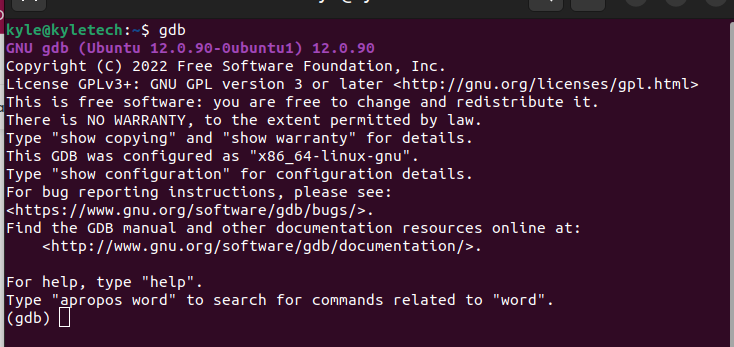
There are various ways to invoke the GNU Debugger. You can directly type gdb on the terminal to open its console.
Alternatively, you can call the debugger with an executable file. If you have an executable file, like a C or C++ program, that you wish to debug, you can compile it using the -g option. For our example, we will use a sample1.cpp file.
To compile it using the g++ compiler, the command will be:
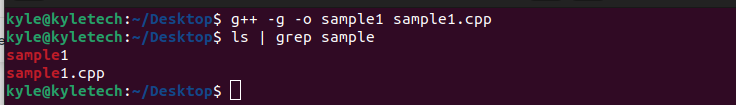
Here, we are adding the -o option to write the compiled program to the file named sample1.
Once compiled, you can invoke the GNU Debugger while attaching the compiled output file to debug. The command will be:
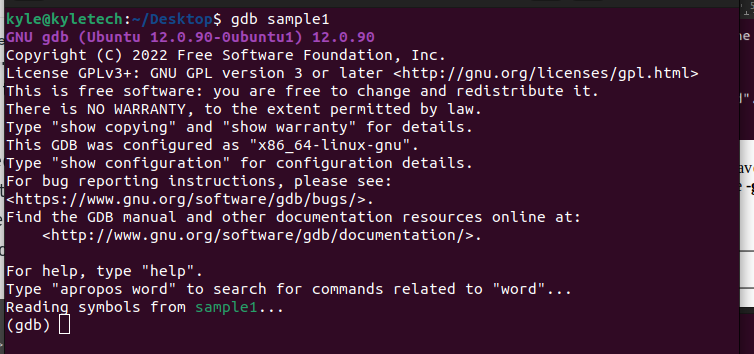
A console opens up, and you can use the available GDB commands to execute different activities. The common commands include:
1. quit: to exit the GDB console, type quit or q.
2. run [args]: based on the functions in the program, you can invoke the function to run using this command and add the needed arguments. For our case, we have the getSquare function, which takes an argument of the number. Therefore, if we need to get the square of a number, we type run followed by the number. For instance, let’s get the square of 6. The output will be as shown below:

At the bottom, you can note the program returned the output of the square. You can run more options with different arguments.
3. help: it opens the manual page for the GNU Debugger with all classes of commands available for use.

You can narrow down the help page by specifying which class of commands you wish to get their manual page. For this, the syntax is used below:
For instance, to get the manual page for the class running, the following output will be:

4. break: when you need to debug the program, you can add various breakpoints using the break command. Besides, there are multiple ways to add a breakpoint.
The common ways include:
break [line number]
break [function name]
break *[address]
For instance, if you know a specific function name in the program and you wish to create a breakpoint at it for debugging, you can use the previous syntax. Let’s create a breakpoint for a function named getSquare in the following program:
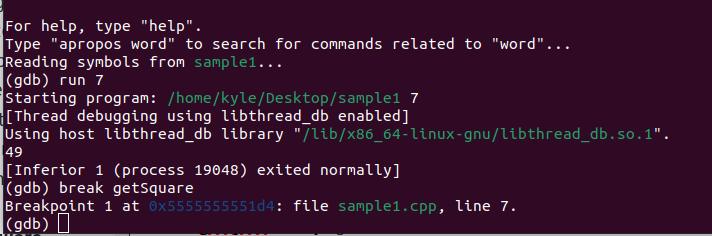
In the previous output, we created the breakpoint and the displayed information in the console.
If you try to execute the program, it will pause at the breakpoint. For instance, let’s get the square of 12 using run 12.

The debugger halts at the breakpoint where the specified function name is. At this point, you can debug your program and proceed once you have everything working fine.
5. Continue or C: When debugging is completed, and you wish to resume executing the command without the set breakpoint, run the continue command. It will execute the command until the next breakpoint or the end of the program. If you wish to add the number of times to repeat the continue command, add the count.
The two syntaxes are:
c [repeat count]
For our case, let’s continue without any repeat counts.

It gives the output of the halted command. If we had different arguments, it would provide each result after a breakpoint. For instance, let’s invoke run 4 6 8, then use the continue command to see what happens.
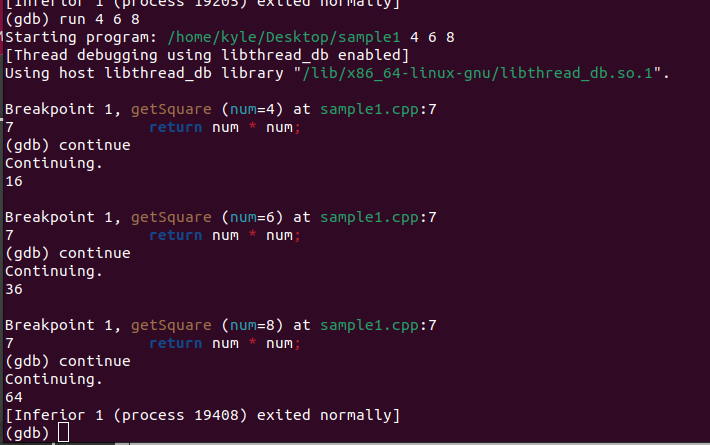
You will note after each argument that the program meets a breakpoint. When we run the continue command, it resumes its execution.
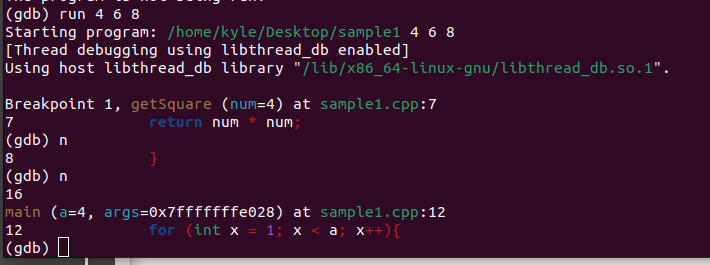
6. next: when the program meets a breakpoint, you can type next or n to print the next line in execution.
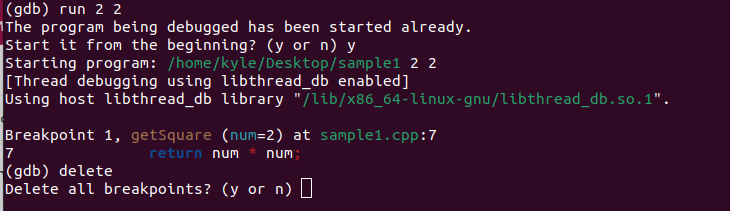
7. delete: if you have different breakpoints and checkpoints, you can delete them using the following command. If you run d or delete with no arguments, it deletes all breakpoints and checkpoints. However, you can specify which to delete by selecting its number.
8. clear: to delete a breakpoint associated with a given function name, use the next clear command followed by the function name:
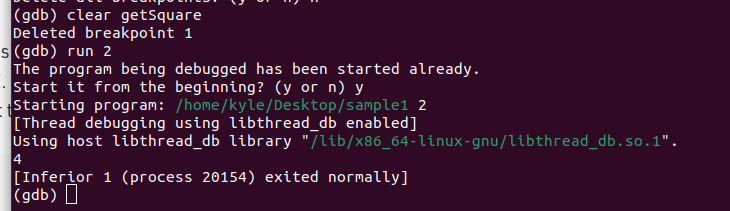
At this point, we no longer have any breakpoint in our program.
If deleting a breakpoint is not an option, how about disabling and enabling them whenever you wish?
9. disable and enable: to disable a breakpoint, specify its number.
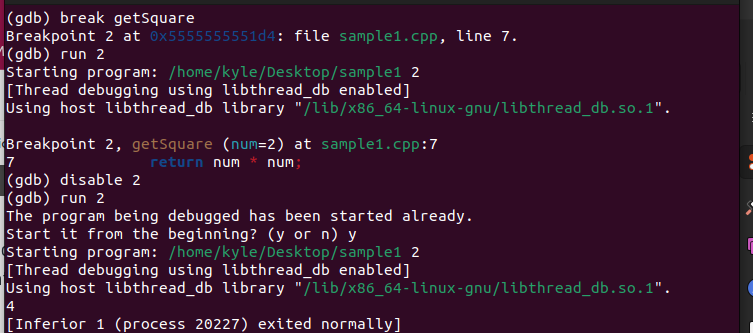
Later, use the enable command followed by its number to activate it back.

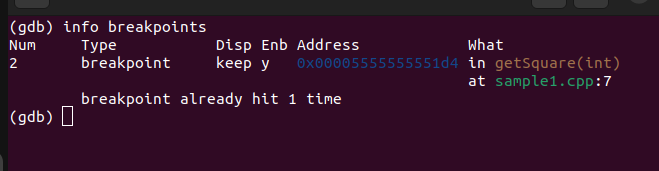
10. info: you can get the details of the available checkpoints and breakpoints. Use the following command to get the details of all the breakpoints or checkpoints:
info checkpoints
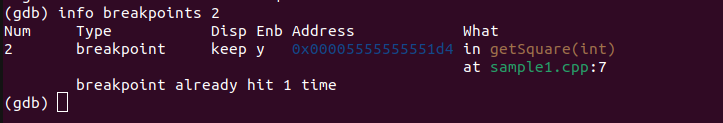
To specify a breakpoint or checkpoint, use the following syntax:
info checkpoint [breakpoint-number]
11. set args: to set an argument list to be used when executing the run command, use set args followed by the arguments. For instance:
If we invoke the run command, it will get the square of the two arguments.
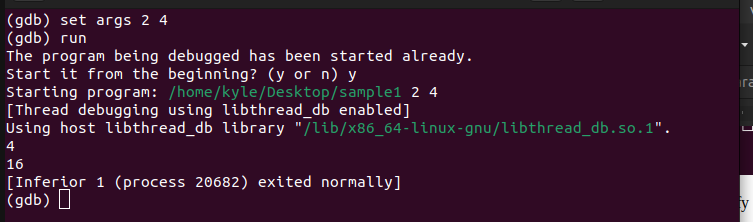
You can view the available list of arguments using the show args command.

Conclusion
We’ve covered the most common GDB list of commands in Linux. With a bit of practice, it will become easier to use the commands to achieve different functionalities. Hopefully, this article provided an upper hand in using the GNU Debugger commands.