
How to install Perf
Perf is not installed by default on Linux systems, and as such, you need to install it manually.
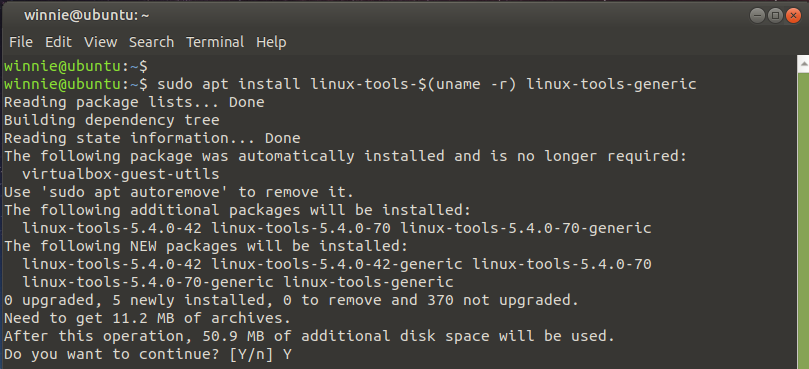
On Ubuntu/Debian, execute the following commands:
$ sudo apt install linux-tools-$(uname -r) linux-tools-generic
Once RHEL and CentOS systems, execute:
On Fedora
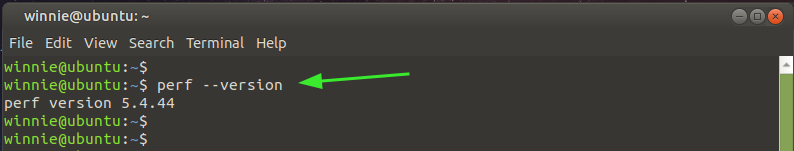
To verify that Pef is installed, run the command:
NOTE:
Perf command displays incomplete results when working on virtualization platforms such as VMware or VirtualBox. This is because the virtualization technologies do not provide access to hardware counters as other technologies such as XEN or KVM do.
For best results, ensure you are working on a physical machine or a virtual machine riding on KVM or XEN virtualization technology.
Basic Syntax
The Perf command takes the following syntax
NOTE:
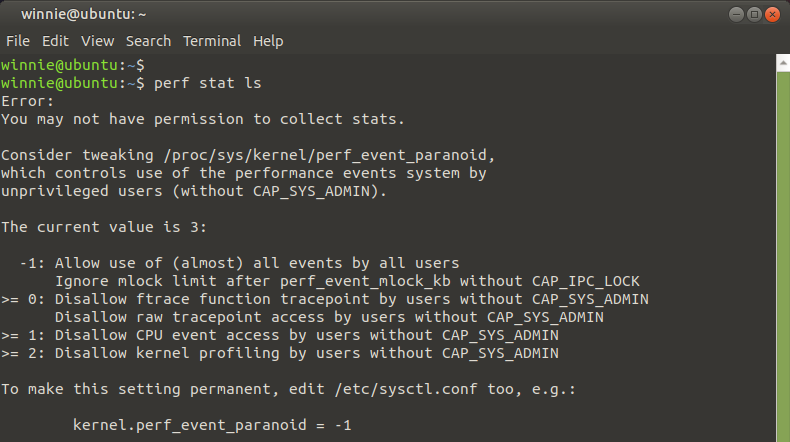
By default, the perf command is a reserve for the root user, and if you run the commands as a regular user, you will encounter a permissions error, as shown.
This is to run the following command to grant regular user permissions to use the perf utility.
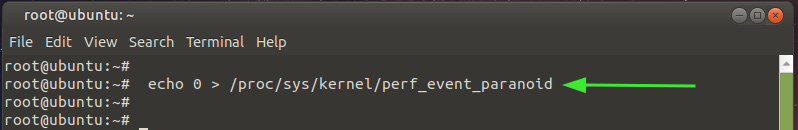
To make the changes permanent, edit /etc/sysctl.conf file and append the line below.
Then save the changes and exit.
Perf is usually executed with subcommands. We are going to cover some of the commonly used subcommands in this guide. However, to get a better picture, visit the man pages.
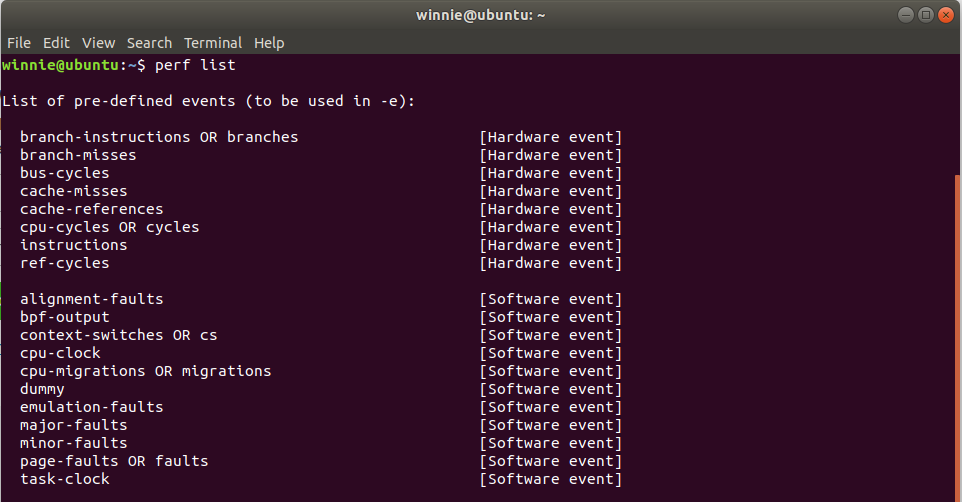
List events using perf list option
The perf list option lists all the symbolic event types, including hardware, software, and kernel events.
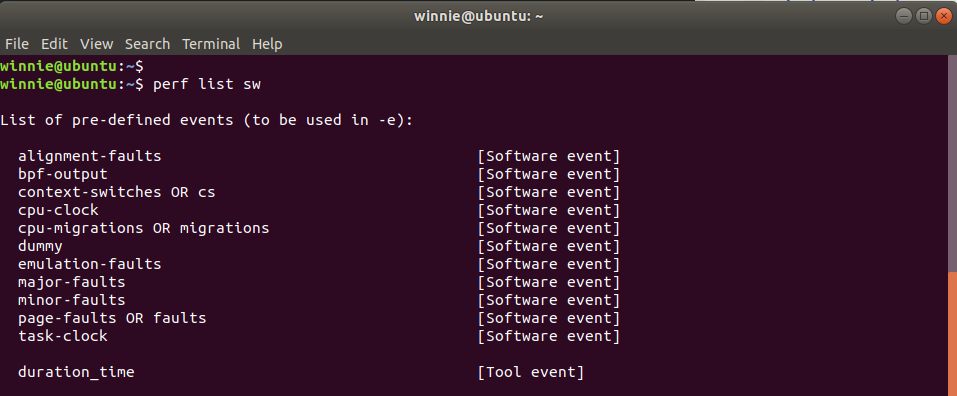
To narrow down to a specific event category, you can suffix the command with the category name. For example, to view software events, run:
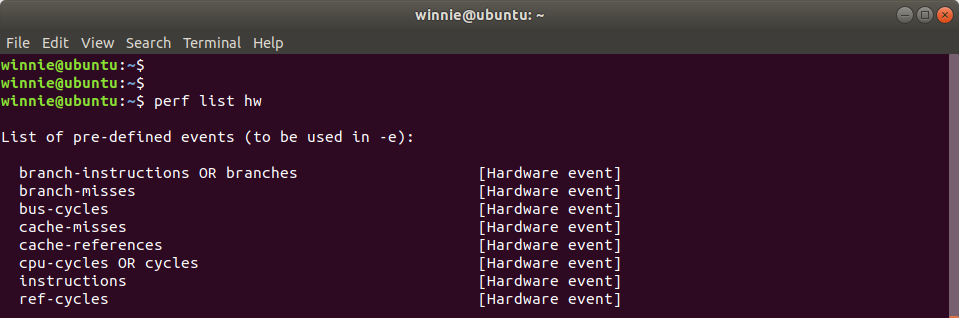
To view hardware-related events only, run:
Collect performance statistics using perf stat
With the stat option, you can gather performance statistics when a command is executed on the terminal. For example, to gather statistics of ls command, execute:
From the command, we can see that the execution took 1.9 milliseconds of CPU. You can view other statistics such as the number of cycles, instructions, branched, and branch-misses.
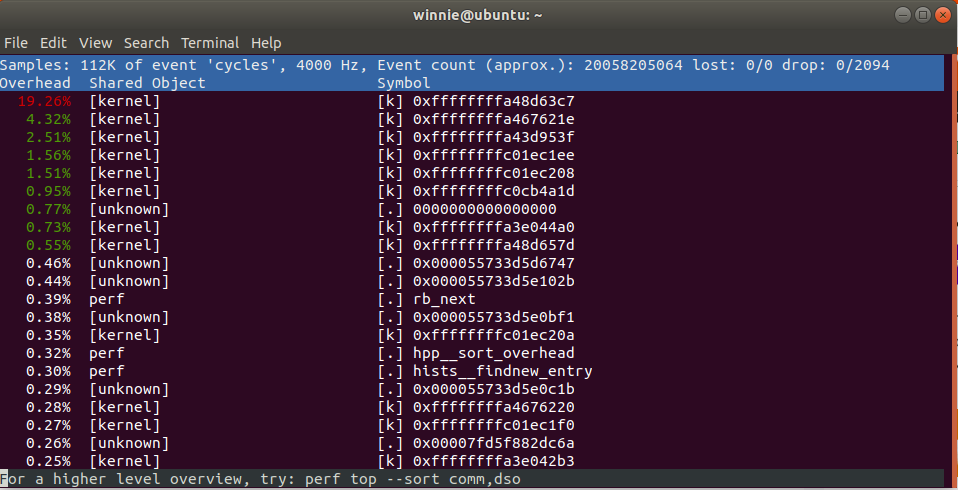
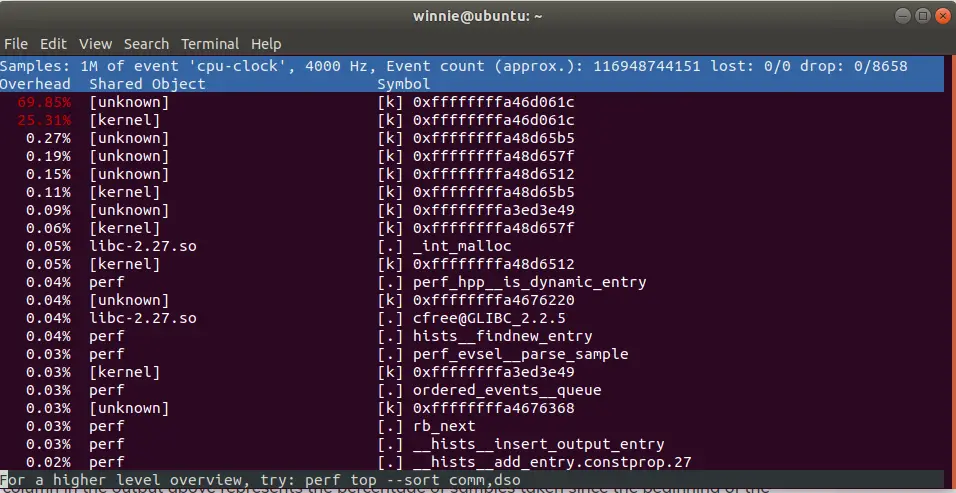
Display real-time system profile using perf top
The perf top command provides a live analysis or a real-time system profile of your CPU. The -a flag allows you to view all the existing event types
The -e option allows you to select an event category among the multiple categories listed in the perf list command. For example, here, we are displaying the live analysis of the cpu-clock events.
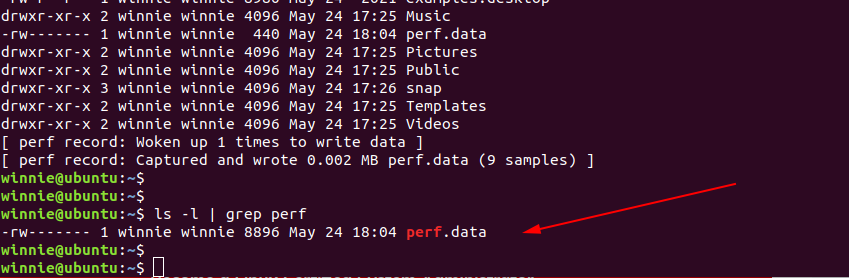
Record statistical data of a command
The perf record command executes a command and saves the execution data in a perf.data file in your present directory
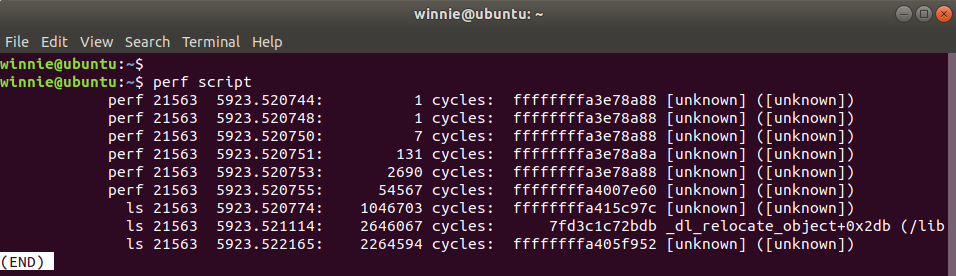
The perf script command then allows you to skim through the data saved in the perf.data file.
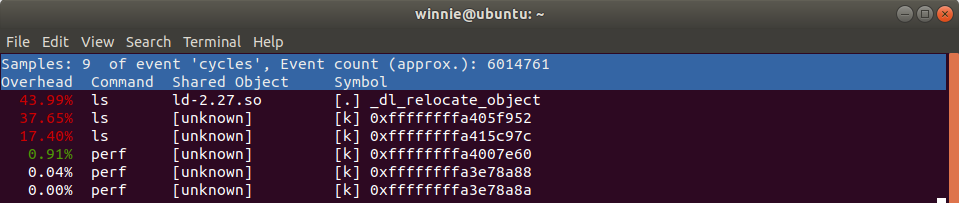
Lastly, you can format data into a performance report using the report subcommand as shown.
Those are the main perf subcommands that are commonly used to retrieve the system profile performance. They have predefined man pages which can be accessed as follows:
When the subcommand option can be list, top, record, report, or stat.
Summary
We have shed light on the perf command, which comes in handy in viewing your system’s CPU performance and events. The perf command gives you insights on which programs take the most execution time and helps you to optimize your system. There is more detailed documentation maintained in the Perf Wiki.