Gnuplot
Gnuplot is a free and open source command line utility that can be used to create plots and graphs from datasets and mathematical functions. To create graphical plots using Gnuplot, you will need to feed data to the app from the command line. Gnuplot will then process the data and show a plot in a separate graphical window. You can also export plots to external file formats using Gnuplot. Other main features of Gnuplot include ability to plot both 2D and 3D graphs, support for automatic creation of graphs using its scripting language, ability to draw plots in a variety of styles like histograms and heat maps, and so on.
To install Gnuplot in Ubuntu, use the command mentioned below:
Gnuplot can be installed in other Linux distributions from the package manager. More packages and installation instructions are available here.
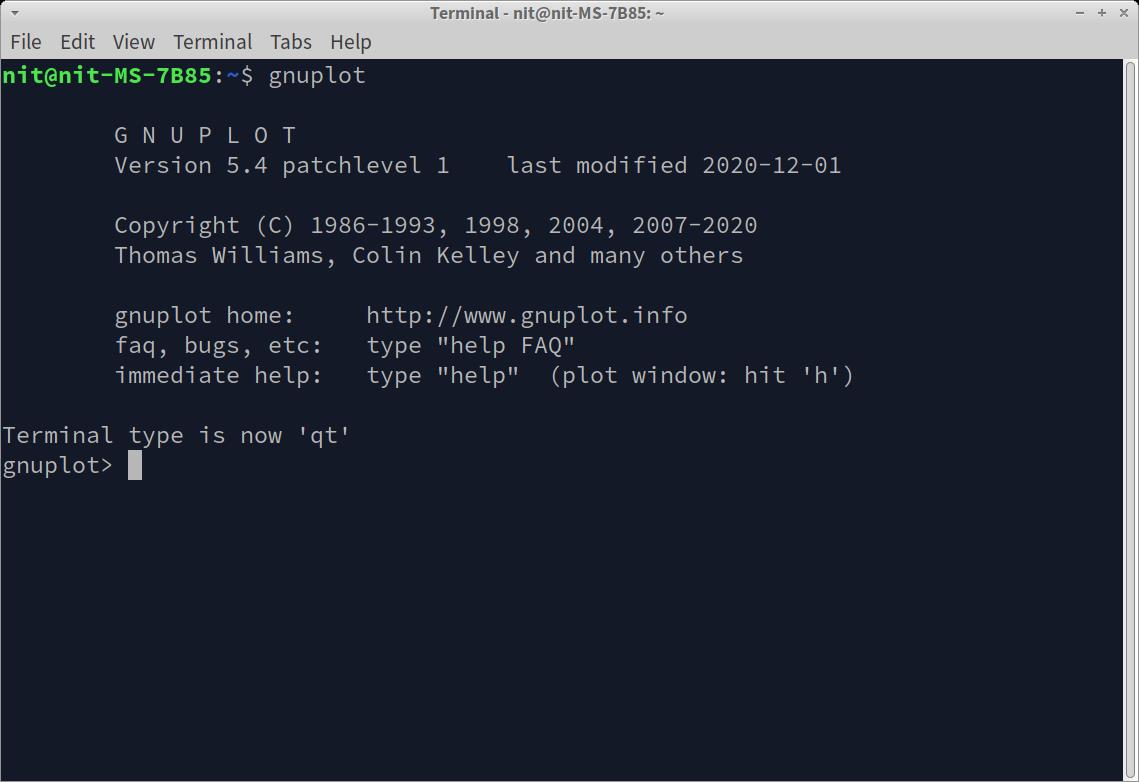
To create plots, you will need to invoke the Gnuplot interactive shell. To do so, run the command below:
You should see a new prompt in terminal like this:
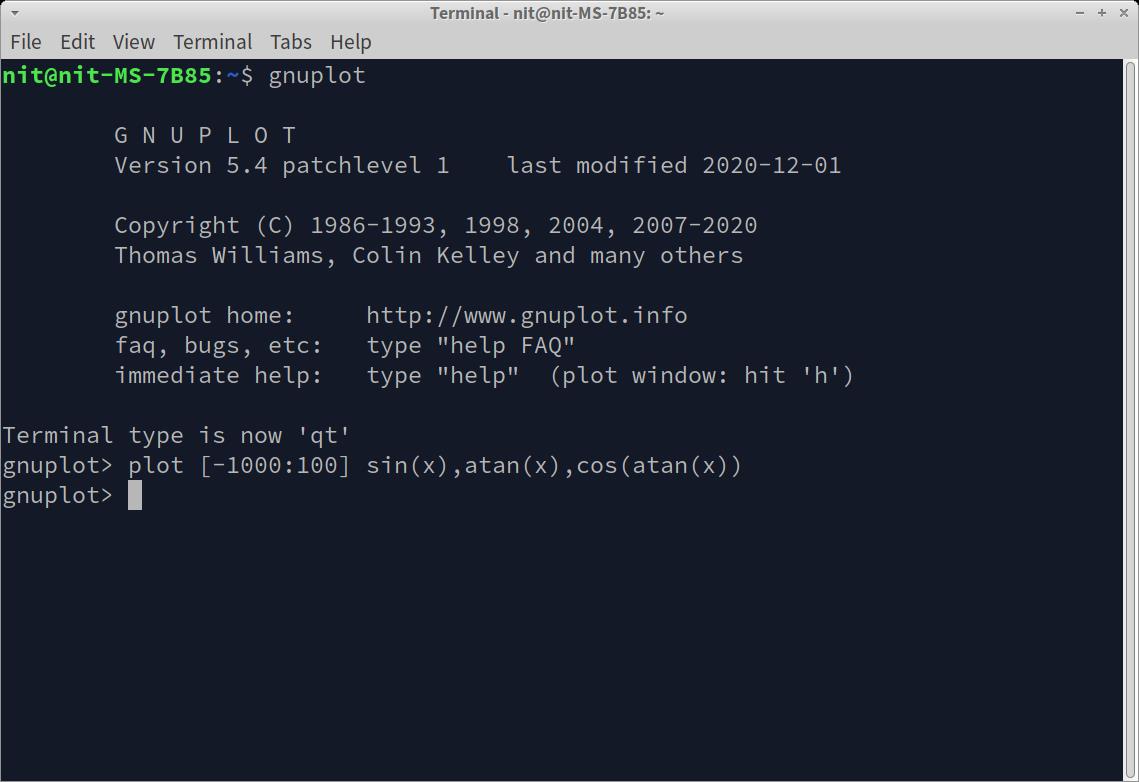
On the Gnuplot interactive shell, you can now enter the “plot” or “load” command supported by Gnuplot to draw plots (as shown in the screenshot below).
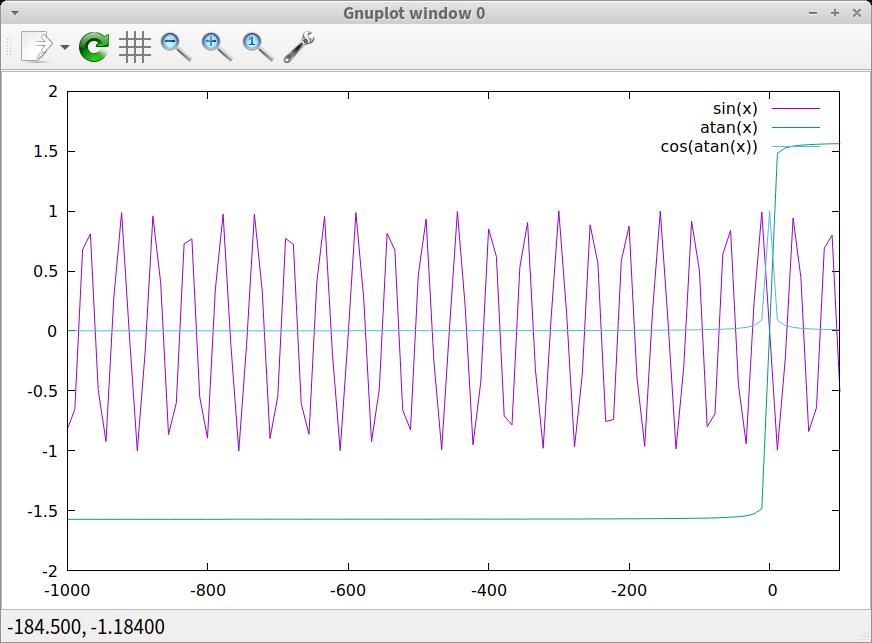
Once Gnuplot is done with processing the dataset or mathematical expression, you will be able to see the plotted graph in a new window.
For more information on Gnuplot and expression syntax, run the following two commands:
$ man gnuplot
You can access official Gnuplot documentation from here. An example repository containing numerous Gnuplot demos is available here.
Veusz
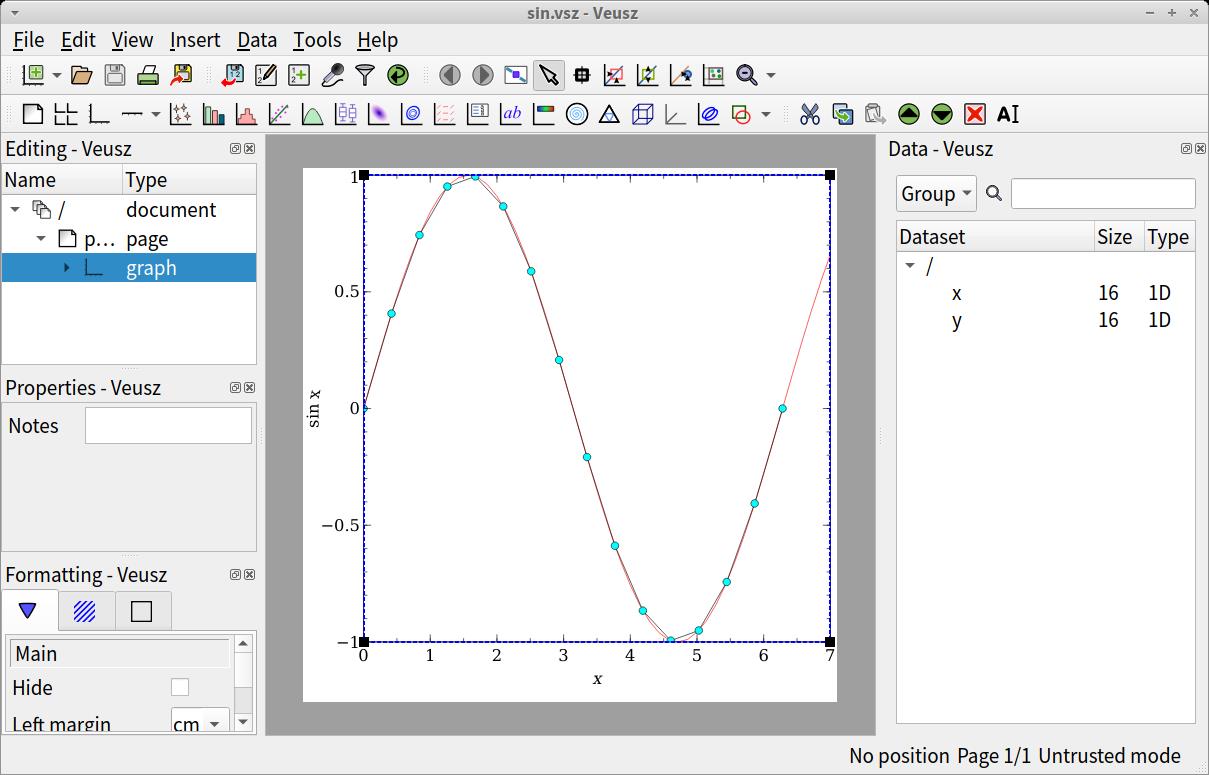
Veusz is a free and open source plot creation program that allows you to create plots by creating the datasets in the app itself. It also supports importing datasets from numerous other file formats like CSV and plain text. You can use it to create a variety of 2D and 3D data plots, export them to different file formats, use Python scripts to create new functions for plotting, and tweak plot elements by editing individual widgets. You can also extend it by writing custom plugins in Python.
To install Veusz in Ubuntu, use the command mentioned below:
Veusz can be installed in other Linux distributions from the package manager. More packages and installation instructions are available here.
Matplotlib
Matplotlib is a popular Python module that can be used to create plots and graphs by feeding data from Python scripts and programs. It also supports plotting of graphs using Matlab syntax. Other main features of Matplotlib include ability to create interactive figures, ability to configure look and feel of plots, integration with third party GUI frameworks and IDEs, interactive command mode, ability to export plots to many different file formats, supports 2D and 3D plots in numerous styles and layouts, and so on.
To install Matplotlib in Ubuntu, use the command mentioned below:
Matplotlib can be installed in other Linux distributions from the package manager. You can also install it from the pip package manager by following installation instructions available here.
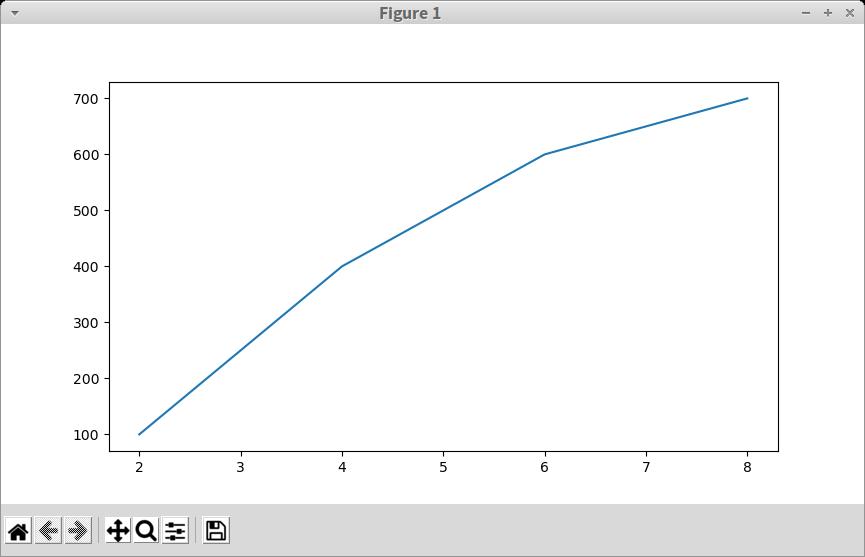
A very basic Matplotlib plot can be created using the Python code specified below:
plt.plot([2, 4, 6, 8], [100, 400, 600, 700])
plt.show()
The code imports Matplotlib’s pyplot interface to draw and show the plots. A plot is created from two lists supplied as a dataset to the “plot” method. The “show” method then draws the plot and shows a graphical window on your screen. After running the above code sample, you should see the following window on your screen:
For more information on Matplotlib, its API and example code, read its documentation available here.
ZeGrapher
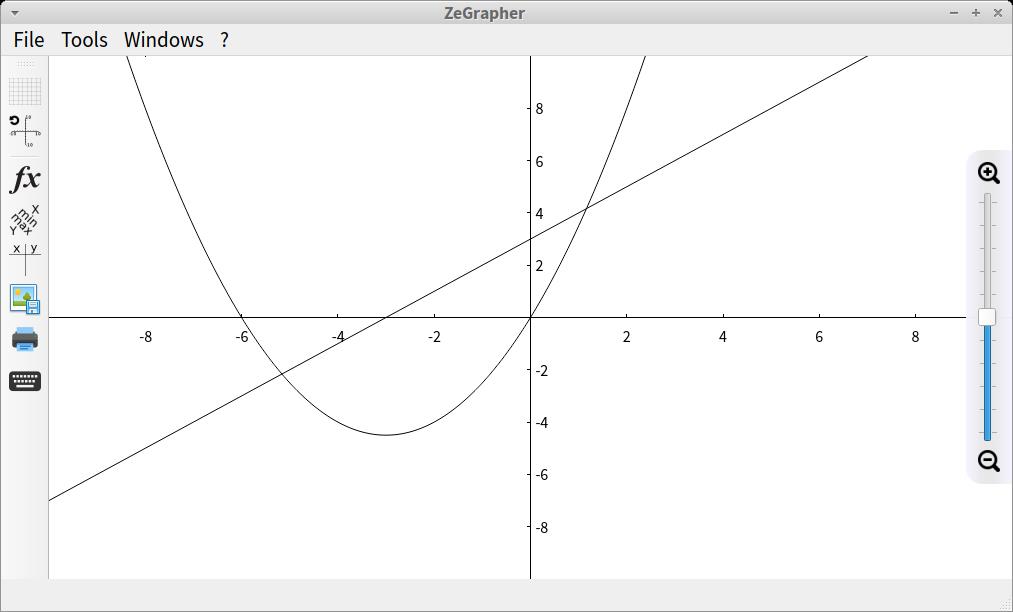
ZeGrapher is a free and open source app that can create plots and graphs from different types of datasets. It comes with a built-in expression editor that can be used to create and input mathematical functions. ZeGrapher will then plot and and show graphs matching the datasets obtained by evaluating the functions entered by the user. Other main features of ZeGrapher include ability to compare and visualize upto six functions at the same time, ability to create animated graphs, ability to import data from CSV files, a built-in option to export graphs to different file formats, ability to tweak look and feel of graphs, and so on.
To install ZeGrapher in Ubuntu, use the command mentioned below:
ZeGrapher can be installed in other Linux distributions from the package manager. More packages and installation instructions are available here.
Lybniz
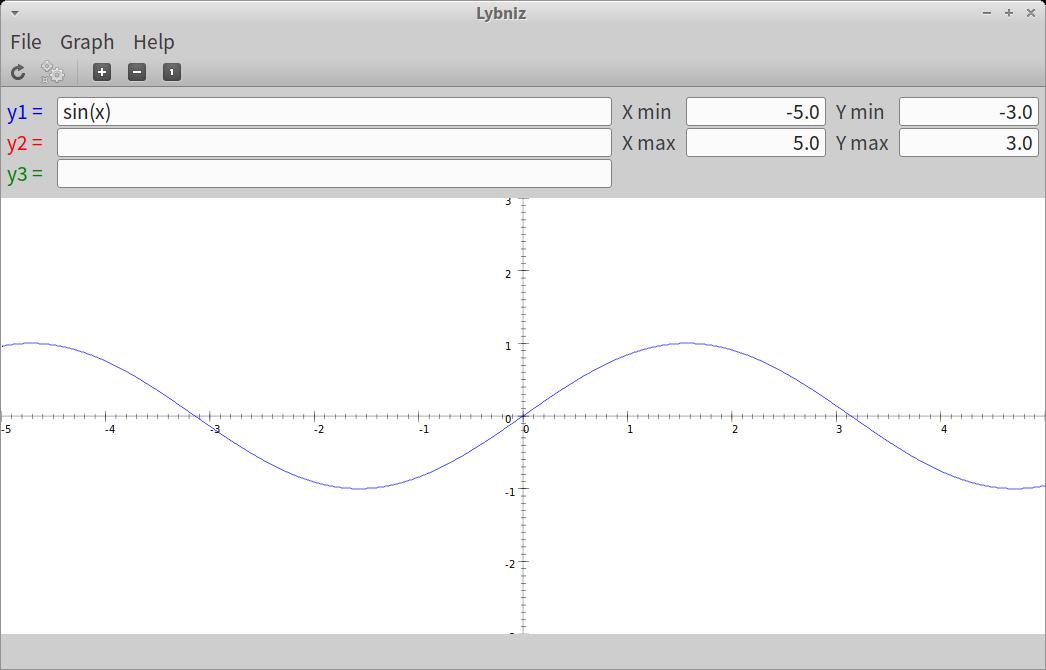
Lybniz is a basic data plotter that can be used to create graphs from three functions at the same time. You can define the functions in Python or C like syntax. Other main features of Lybniz include ability to change scales, a built-in option to export plots to PNG file format, ability to resolve and evaluate user defined functions, includes support for Python functions from the math module and so on. Lybniz is very simplistic and doesn’t come with too many features. However, it can be useful if you are looking for a simple plotter without a lot of UI clutter.
To install Lybniz in Ubuntu, use the command mentioned below:
Lybniz can be installed in other Linux distributions from the package manager. You can also compile it from its source code available here. An online version that runs in a web browser can be accessed from here.
KmPlot
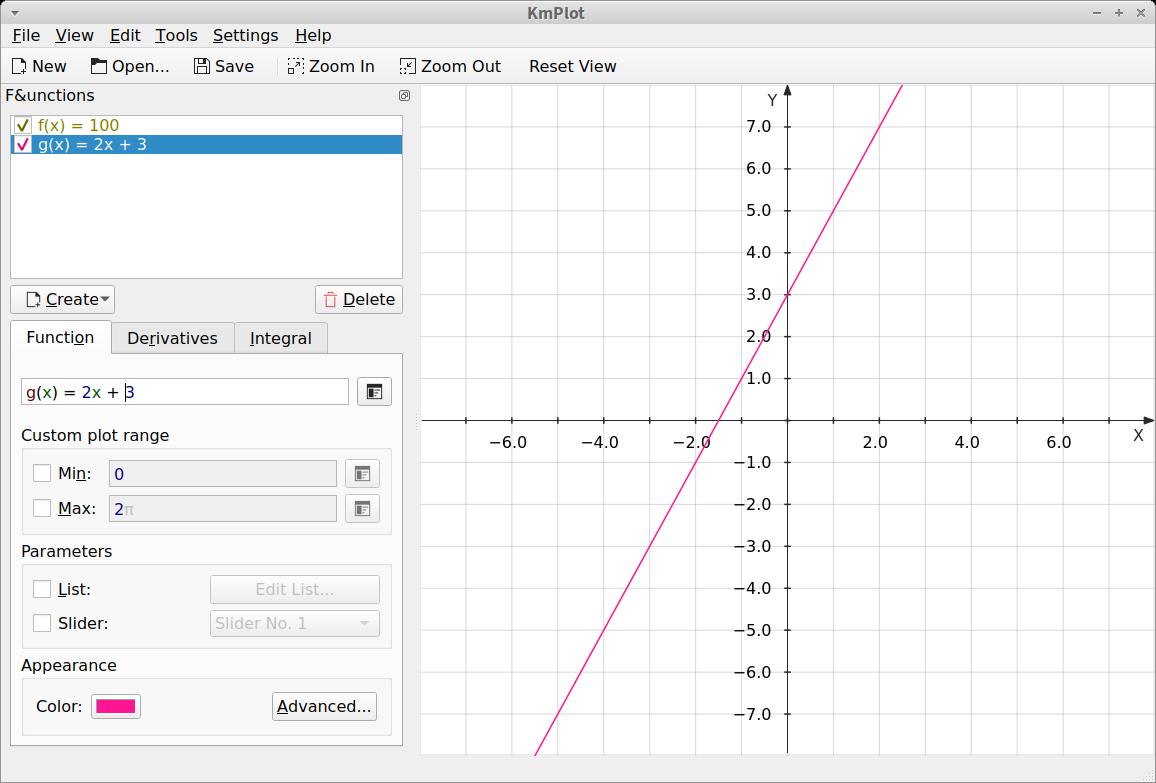
KmPlot is a free and open source data plotter that is part of the KDE application suite. It contains a built-in expression creator that you can use to define multiple mathematical functions. KmPlot will then evaluate these functions and draw plots accordingly from the obtained datasets. Other main features of KmPlot include ability to export plots to multiple file formats, includes support for different types of coordinate systems, ability to create plots from derivatives and integrals, includes options for customizing colors and look and feel of graphs, supports crosshair based movement for finding precise coordinates, includes an option to redefine axes, and so on.
To install KmPlot in Ubuntu, use the command mentioned below:
KmPlot can be installed in other Linux distributions from the package manager. You can also compile it from its source code available here. A snap package provided by the KDE team is available here.
Conclusion
These are some of the best data plotting applications that can be used to create professional graphs and plots that are especially useful for creation of scientific journals and other such physical publications. Some of these applications are full featured software suites that include support for programming languages like Python for building advanced expressions and datasets in the app itself.

