
The world of data science has seen the advent of countless applications and frameworks dedicated towards solving the problems of efficiency and utility. Some offer the ability to interact with these applications by writing code while others provide a more interactive graphical interface to use the applications. Knime is one such framework that offers a very intuitive graphical user interface. Knime is built around the idea that data analytics and the field of data science research should not be limited to just the people who know how to write code.
Knime is an open-source analytics platform that provides its users with the opportunity to learn as they build. The unique design pipeline that it offers lets the users better understand their own requirements which resultantly ensures a more logical solution coming to fruition. It contains methods and functionality that is ready to use without much need for configurations to be done. This enables the users who are just starting their careers in the domain of data science to be able to achieve much more with very little need for learning the nitty gritties of this field.
More often than not, we see people struggling with algorithmic architectures since without proper understanding of these models, building a stable and logically correct workflow would be fairly complex. Knime solves this problem by providing multiple variations of complex models that are ready to use out of the box. With these architectures, data mining and analysis tasks can be accomplished with ease and proper use of the logical criteria they set out.
Installation
To start with the installation process of the Knime data analytics software, we have to download the wget Linux tool first. It enables the users to easily download the resources off of the internet using the Linux terminal.
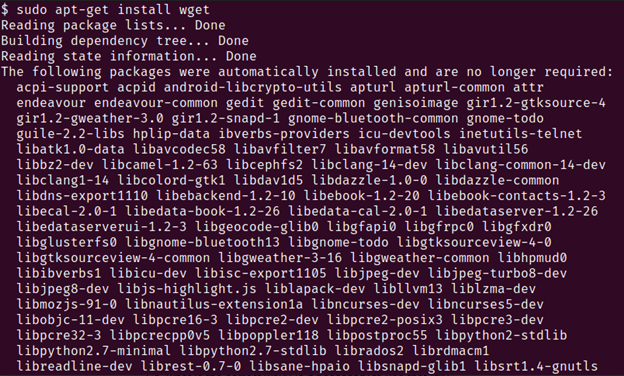
1. We first install wget on our Linux machine using the default apt package manager.
Open an instance of your Linux terminal and run the following command:
You will see a similar terminal output:
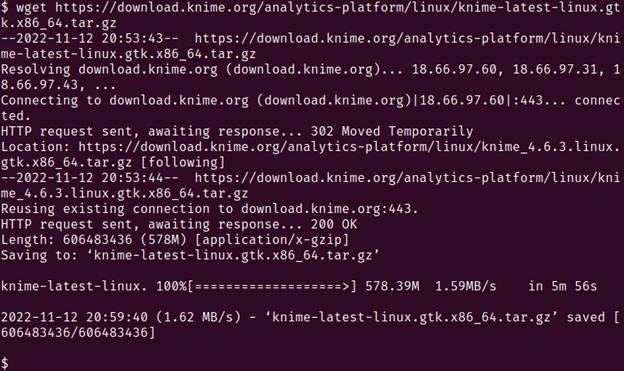
2. Now that we have the wget tool installed on our Linux machine, we use it to download the Knime tool.
This is the Knime link that we will use with wget.
Run the following command in your terminal:
You should see an output which similar to this in your terminal:
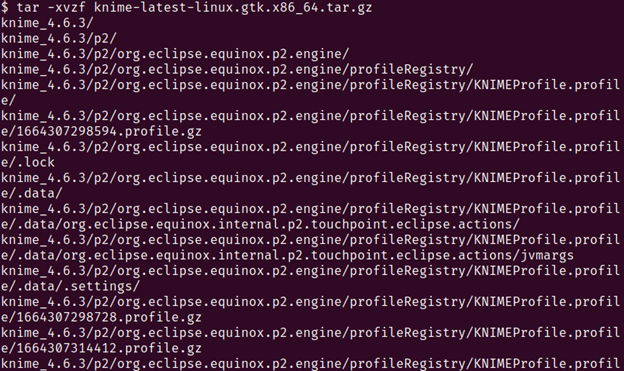
3. We now extract the compressed file that we just downloaded by running the following command in the terminal:
A similar output to the one in the following image should be visible in your terminal window:
4. Change the directory and move into the extracted folder.
Run the following command:
5. Run the executable file in the folder by running the following command in the terminal:
You should see the following terminal output:
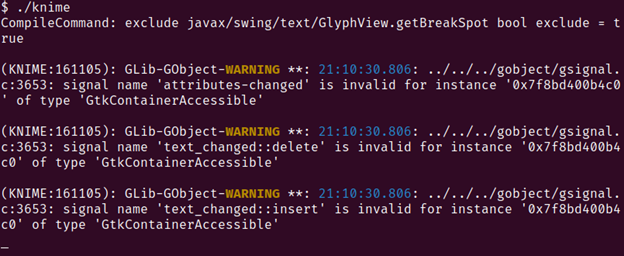
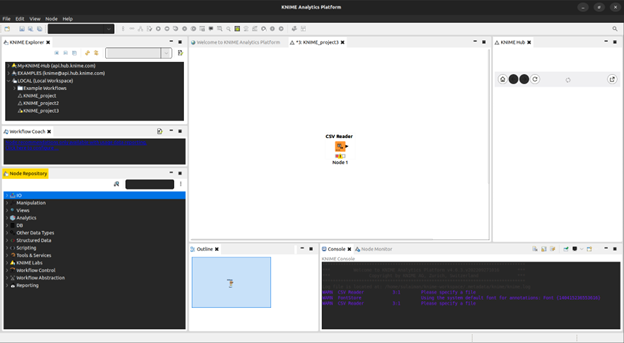
An instance of the Knime application should also open up which looks something like this:
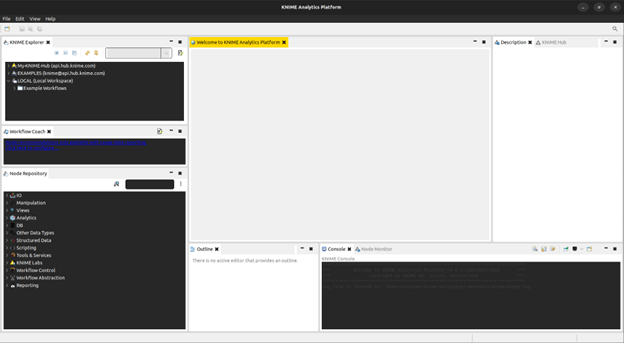
We now have the Knime data analytics tool ready to use on our Linux machine.
User Guide
To begin creating any data analytics workflow, we first create a project by clicking File -> New and following along with the naming options that we are provided with.
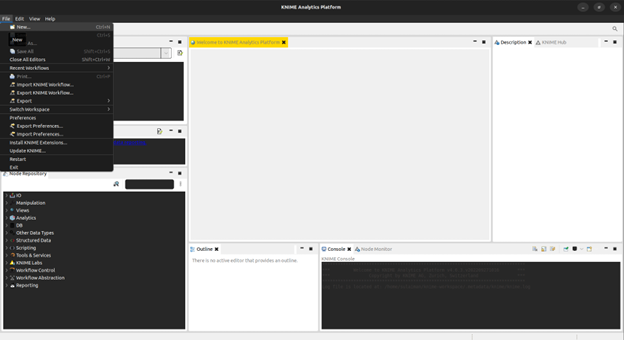
You should see a new tab added with the name that you chose added at the center top of the application.
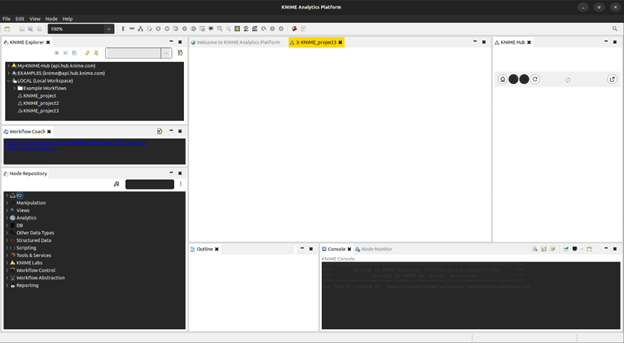
We can now begin creating a data mining algorithm for our specific use case.
To start importing the data, we look to the bottom left of the screen and expand the IO option to select the type of data that we will import into the application.
For the purposes of this experiment, we opt for the CSV Reader option.
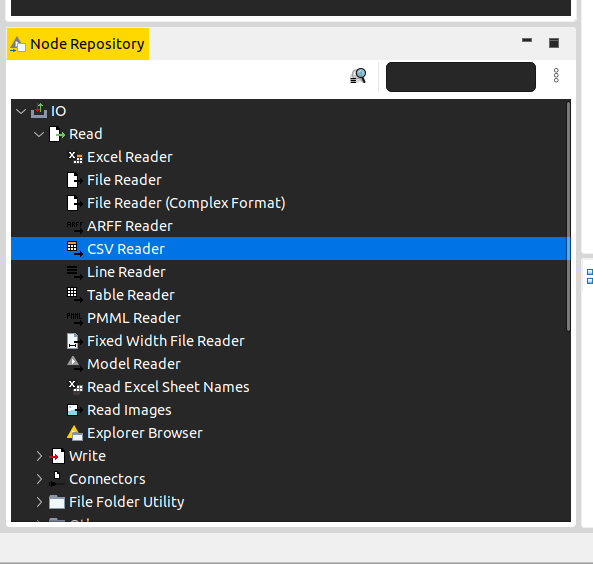
You should now be able to see a CSV Reader widget appear on your Knime canvas, specifying that the input data is parsed using the csv format.
Now that we have our data import selected, we can continue on with what we want to do with this data.
There are numerous different built in algorithms that can be applied on this data that we imported. These algorithms are divided into three main categories which are Mining, Statistics, and Distance Calculation.
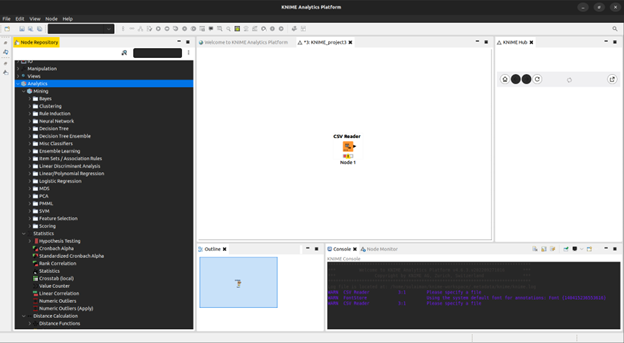
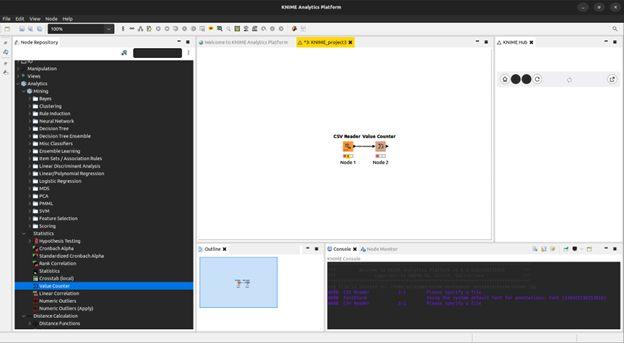
We select a simple Statistics -> Value Counter for this experiment. This shows us the number of values contained in each category of a data set. It also shows us the number of missing values which is a key part of data preprocessing in data analytics.
To display the results of this experiment, we use a barchart utility by selecting Views -> JavaScript -> Bar Chart.
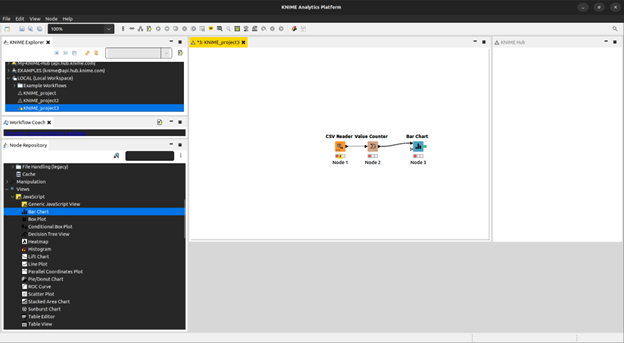
The simple algorithm that we just created counts the values contained in all of the fields of the data set that we provide it. It then proceeds to display the results in the form of a bar chart containing the field identifiers on one axis and count on the other axis.
Conclusion
Knime is one of the very few data mining software tools that use a graphical user interface that allows the users to interact with the application without writing the code. This helps the beginners and researchers test out their ideas without getting bogged down by the understanding of proper coding syntax. Having an intuitive user interface that helps the users to learn the ins and outs of the machine learning and statistical analyses architectures that this platform contains, provides the users with an experience that does not only help them develop a good understanding of the architectures but also helps them utilize them in a better manner.