This is going to be a tutorial on JMap and JStack utilities in Java for beginners. By the time you’re done with this tutorial, you’ll have a better idea about how these two tools can help you with troubleshooting and debugging.
Running diagnostics with JStack
JStack, in essence, is a command-line utility used in troubleshooting. With JStack, you can have the thread dumps for specific programs, processes, or Java core files displayed to identify the problems. This, in turn, reveals more details such as the full class name, name of the method, element’s line number, and the bytecode index. JStack allows you to see what action each line of code is taking when you run the program.
Running diagnostics is what the JStack utility is most commonly used for. You apply the JStack command to a specific core file/ process, and it reports back every thread linked with the JVM(internal VM threads included), as well as the original stack frames. In addition to this, JStack can also identify resource usage overlaps(deadlocks) to troubleshoot the program. These features allow users to do away with the need to rely on any other utility to perform a full diagnosis to do away with any bugs or errors in the program.
Driving a Stack Dump
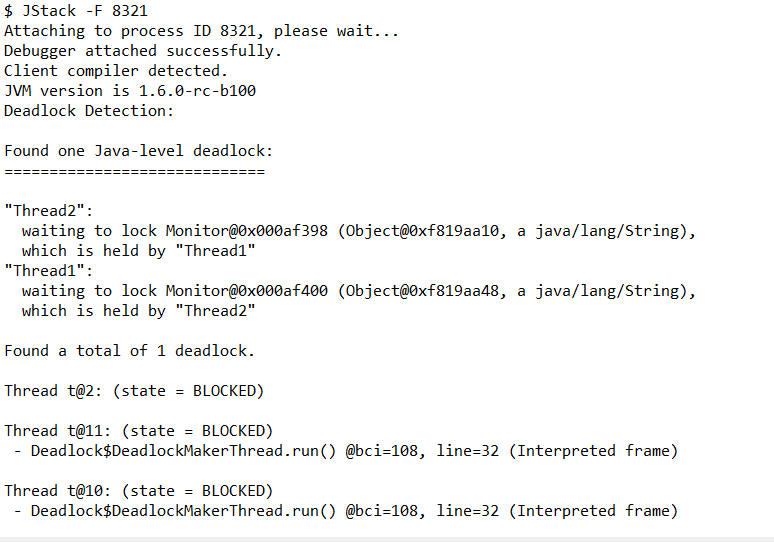
If a program is unresponsive, or if a process is stuck, you can pinpoint the exact root of the problem by running a stack dump. It is especially useful when the JStack processID is unresponsive as well, so you can use the –F switch to your advantage.
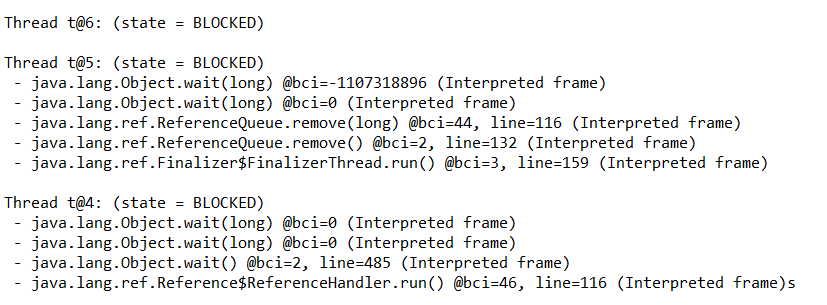
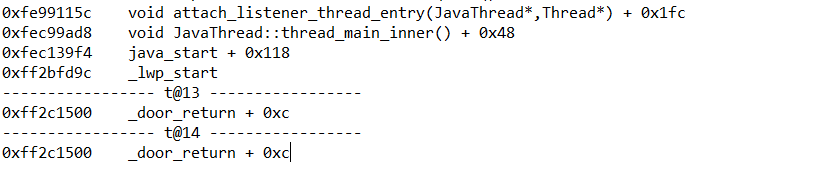
A typical stack dump should resemble the contents below:
Retrieve traces from core dumps
If you’re unfamiliar with core dumps, they are memory dumps that keep a log for files or programs, documenting their contents and state at a certain time, typically when a problem suffers an unprecedented crash. Core dumps are quite flexible in terms of the contents they can hold: and can be made very detailed for particular applications.
To extract the stack traces from a core dump, type out the command below:
Mixed Stack
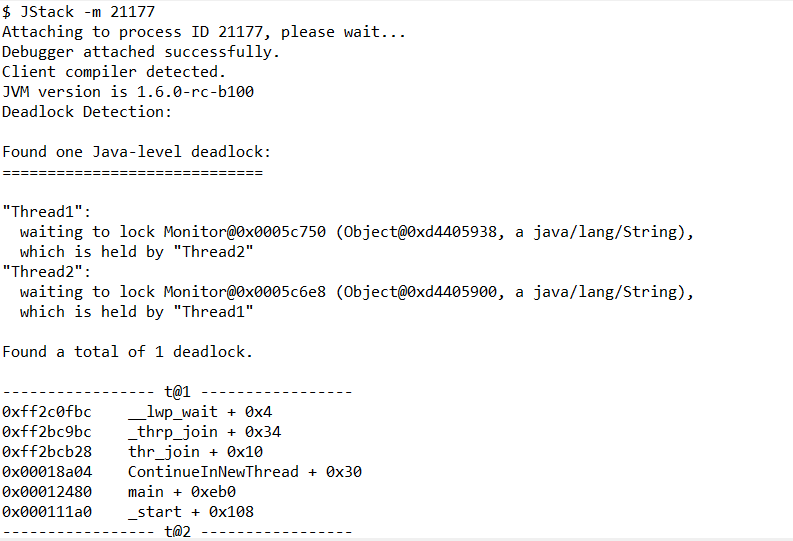
Often you’ll come across errors that are too big to be identified with java stacks alone. This is where you’ll need to pull up the native stack frames and see those with the Java stacks. The native frames are generated using the C/C++ language, and these can be a lifesaver when it comes to running diagnostics.
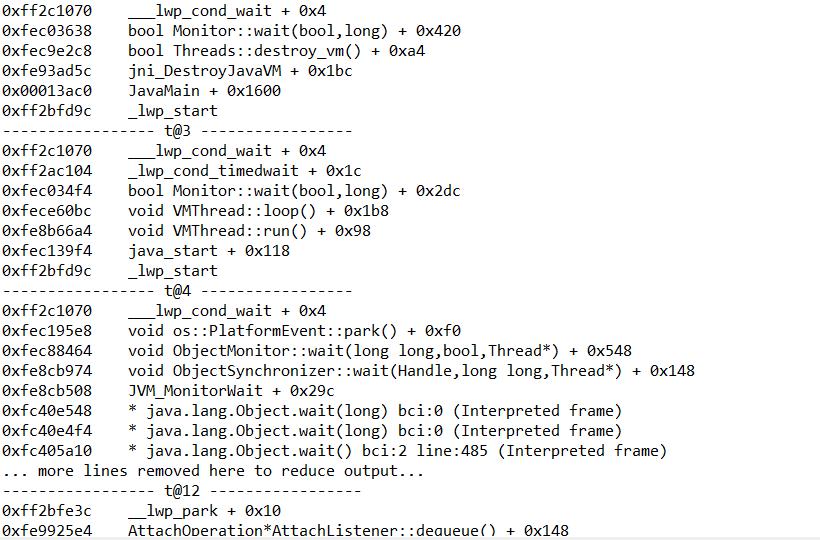
To print the native stacks, use the –m command as illustrated below:
Identifying leaks with JMap utility
As an up and coming Java developer(I’ll assume you’re still a novice, why else would you be on a JMap tutorial?), you’ll be running diagnostics much more often than you may realize. The issues may take the shape of memory cluttering, manifesting itself as a continuously accumulating heap that doesn’t go away that easy, or perhaps as a delay in releasing an ArrayList.
To balance these offsets, you’ll be first identifying these leaks before working to fix them. The most powerful tool you have at your disposal in this regard is the JMap utility. The JMap utility alleviates the problem by recording the size and status of the accumulating heap.
This is how you’ll be using the JMap command when picking out the leaks.
-Heap command
The –heap command reveals information on the heap in detail. For example, you can acquire information regarding the GC algorithms, honing in on specifics regarding each thread involved in any one of its processes. You can also see the heap usage reports, and in quite some fine details too. JMap will reveal information on heat capacity and currently available memory when prompted to generate heap reports.
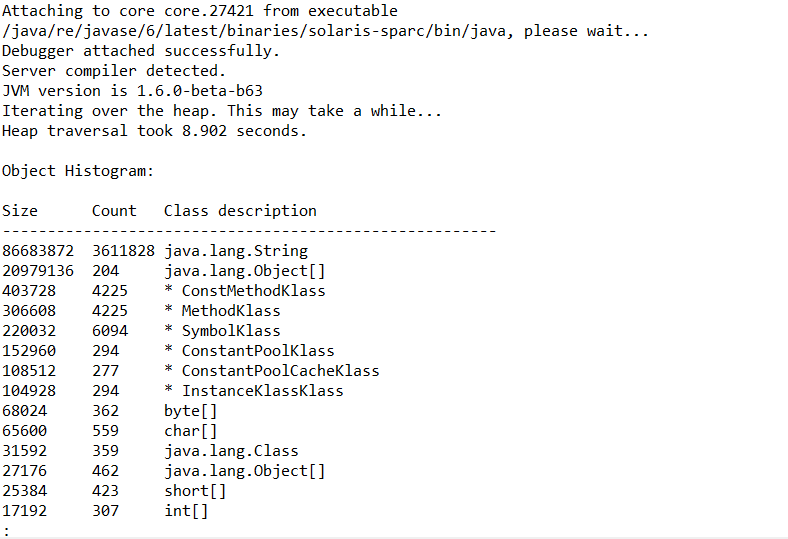
Heap histogram
To better visualize the reports JMap has presented, a histogram can be created. To this end, you have the -histo option that prints the histogram for a java processor core file. When applied to a running process, you’ll see the memory size in bytes, how many objects are occupying them, with their class names.
Before we wrap up:
We need to talk about permanent generation statistics. In java, Permanent generation is a part of the heap that contains all the nitty-gritty of the virtual machine. Among other things, it contains details about the method and class objects. These details include the exact number of classes, number of bytes in service to each class loader, address of the class loader as well as the address of the parent class loader, and an indication of whether the program will be kept or sent to the garbage collection later.
In summary
Now that you know how to use JStack and JMap, you have two of the most important troubleshooting tools at your disposal. This tutorial illustrated how you could identify the roots of different problems in your program by revealing the stacks and native threads. We also discussed how to fix heap leakages with JMap.
That’s it for this lesson. Until next time.