In this article, I am going to show you how to install the Grafana-Zabbix plugin on Grafana. I will also show you how to add a Zabbix server as a data source on Grafana. I will show you how to get started with Grafana data visualization with Zabbix data source as well. So, let’s get started.
Table of Contents
- Things You Will Need
- Network Diagram
- Installing Grafana Zabbix Plugin
- Enabling Grafana-Zabbix Plugin
- Adding Zabbix Data Source on Grafana
- Monitoring Zabbix with Grafana
- Creating a Basic Zabbix Grafana Dashboard
- Where to Go Next?
- Conclusion
- References
Things You Will Need
To follow this article, you must have Grafana installed on your computer. You must have Zabbix installed on your computer as well.
If you need any assistance in installing Grafana on your computer, read one of the following articles:
Ubuntu 20.04 LTS: How Do I Connect Grafana with Prometheus?
If you need any assistance in installing Zabbix on your computer, read one of the following articles:
- Raspberry Pi 4: How to Install Zabbix 5 on Raspberry Pi 4?
- Raspberry Pi 3: How to Install Zabbix on Raspberry Pi 3
- Ubuntu 18.04 LTS: Install Zabbix 4.0 on Ubuntu
CentOS 7: Install Zabbix 4.0 on CentOS 7
Network Diagram
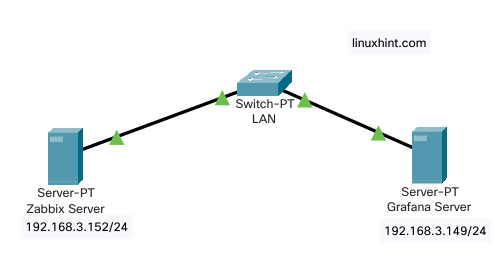
For the demonstration, I have installed Zabbix on a Ubuntu 20.04 LTS host with the IP address 192.168.3.152 and Grafana on another Ubuntu 20.04 LTS host with the IP address 192.168.3.149.
The network diagram of my setup is given below:
Fig 1: Network Diagram
Installing Grafana Zabbix Plugin
To add Zabbix as a Grafana data source, you must have the Grafana-Zabbix plugin installed on the computer where you have Grafana installed.
To install the Grafana-Zabbix plugin on the computer where you have Grafana installed, run the following command:
The Grafana-Zabbix plugin should be installed.
For the changes to take effect, restart the grafana-server systemd service with the following command:
Enabling Grafana-Zabbix Plugin
Once you have the Grafana Zabbix plugin installed, you have to enable it from the Grafana Dashboard web interface.
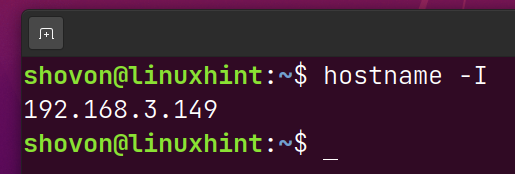
To access the Grafana web interface, you have to know the IP address of the computer where you have Grafana installed. In my case, the IP address of the computer where I have Grafana installed is 192.168.3.149. It will be different for you. So, make sure to replace it with yours from now on.
To access the Grafana web interface, visit http://192.168.3.149:3000 from your favorite web browser.
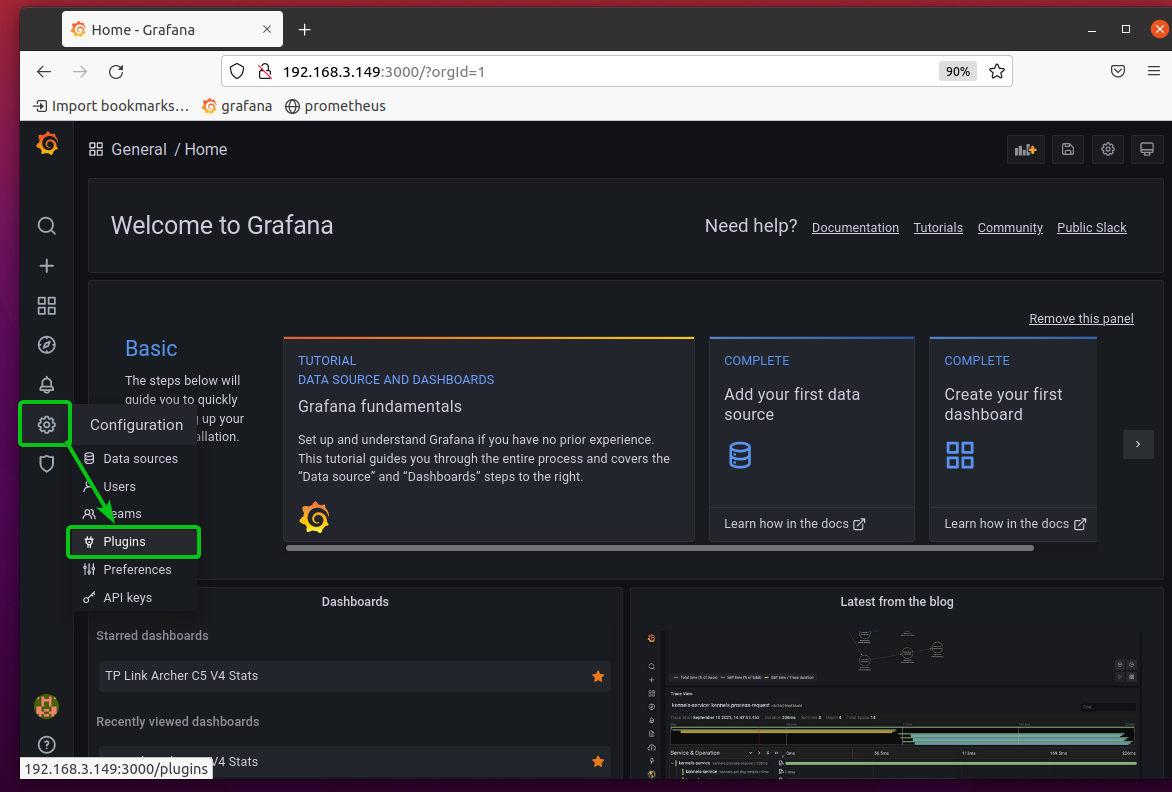
From the Grafana web interface, click on Settings > Plugins as marked in the screenshot below.
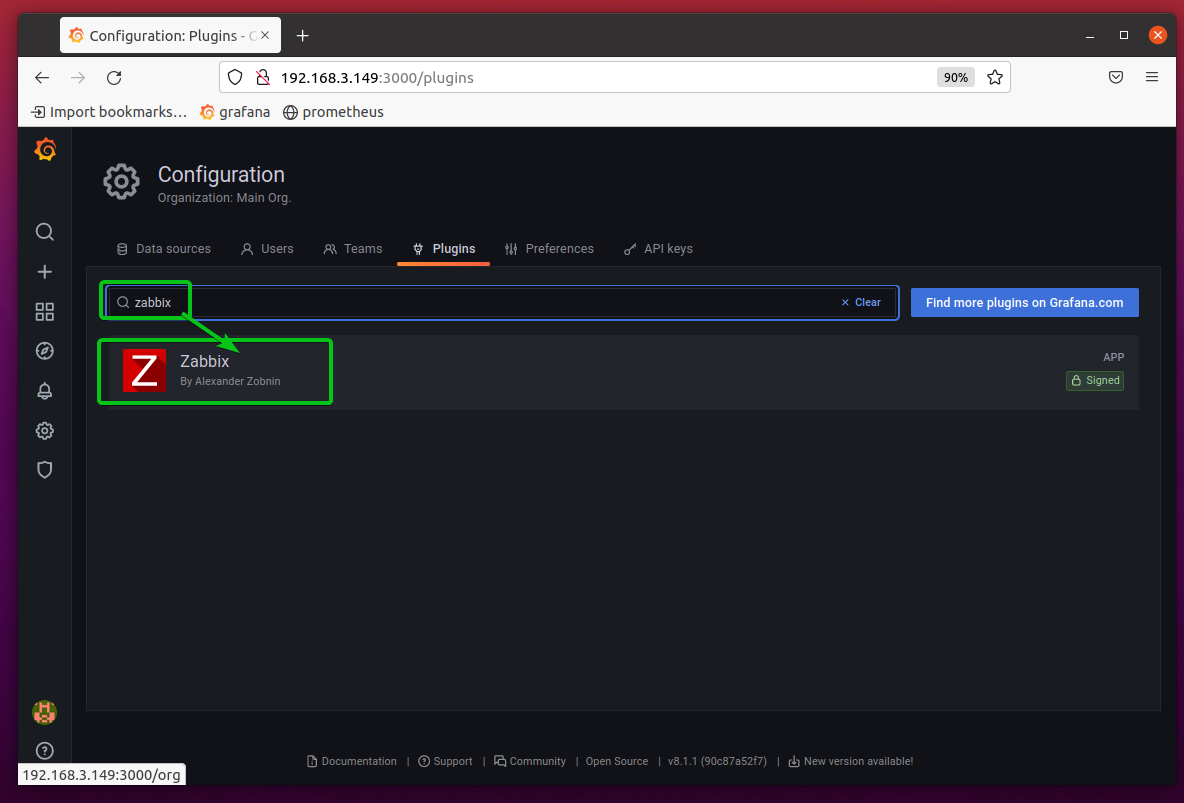
Search for the Zabbix plugin and click on the Zabbix plugin from the search result as marked in the screenshot below.
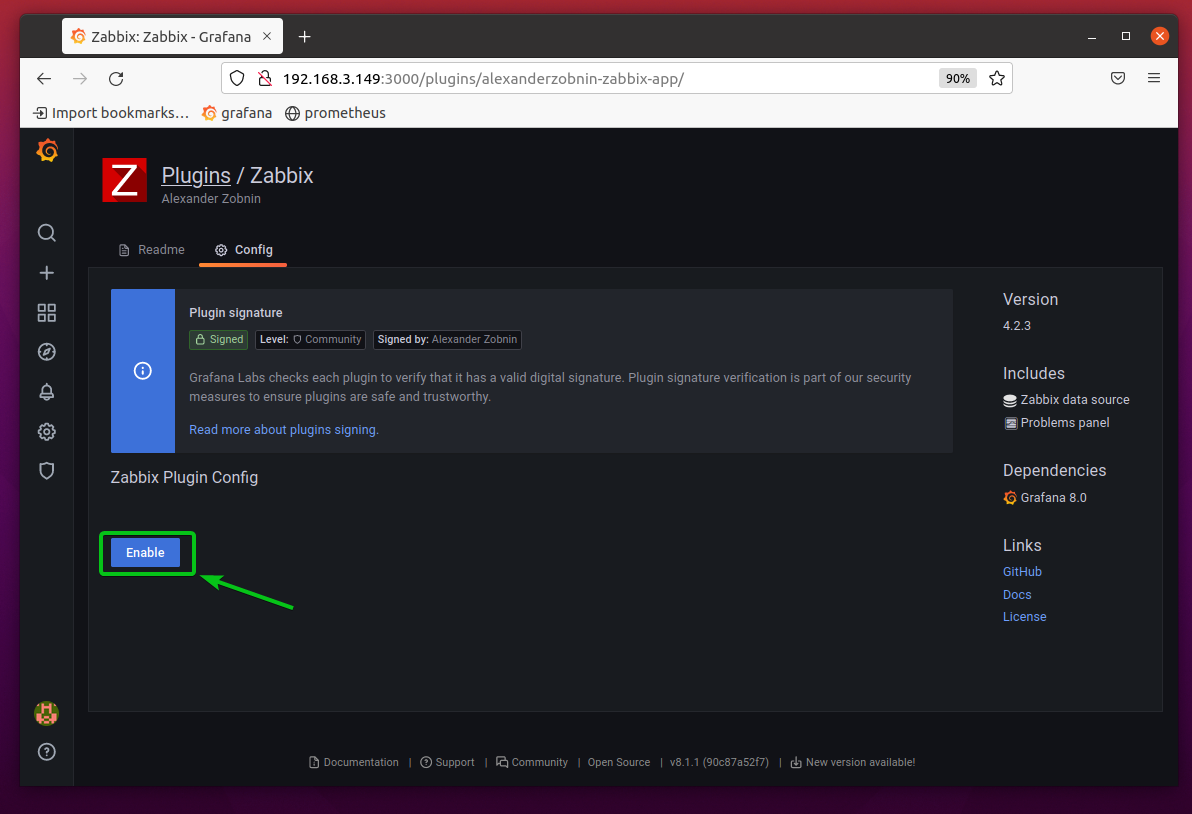
Click on Enable.
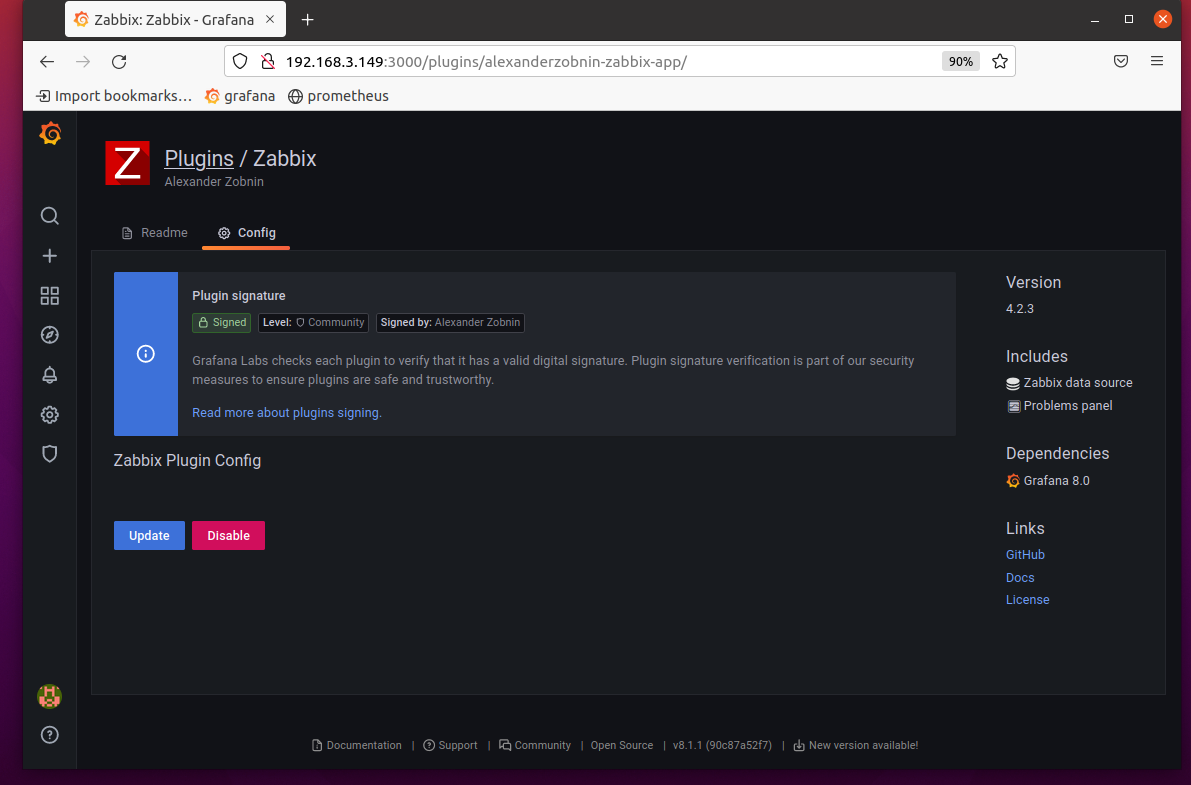
The Grafana Zabbix plugin should be enabled.
Adding Zabbix Data Source on Grafana
Once the Grafana Zabbix plugin is enabled, you can add your Zabbix server as a data source on Grafana.
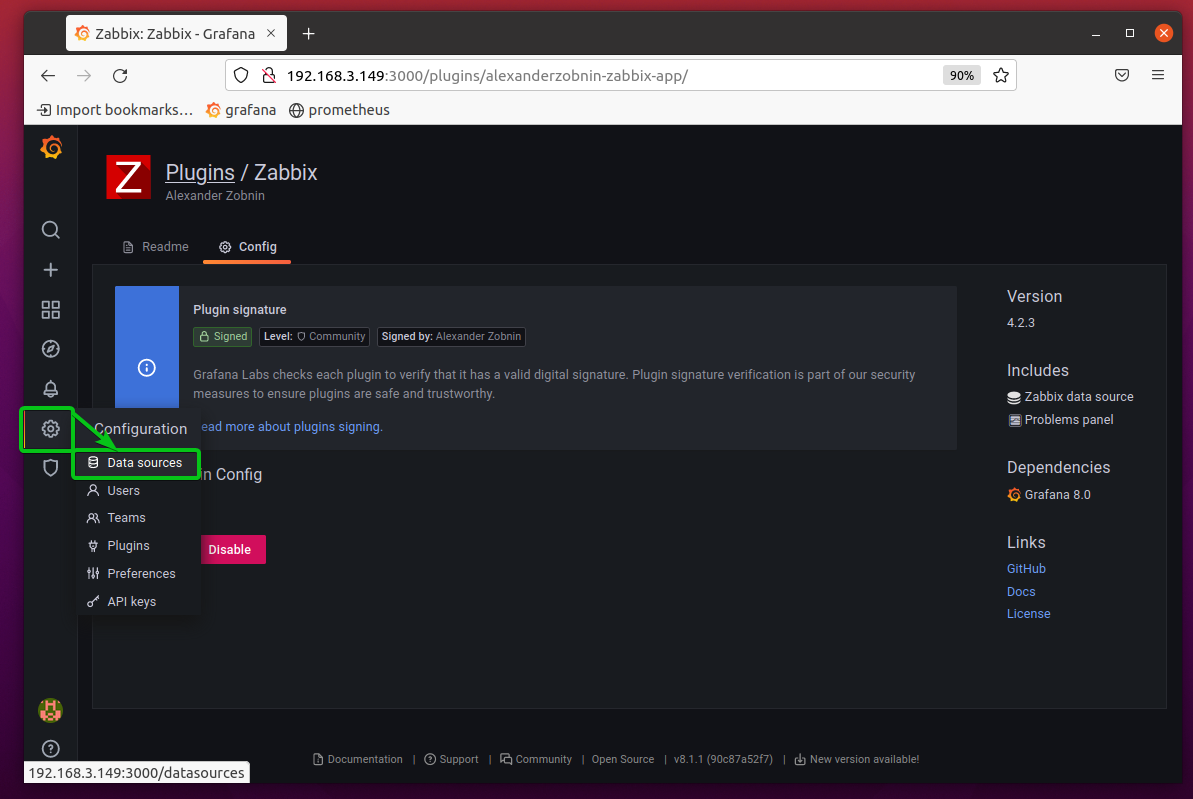
To add your Zabbix server as a data source on Grafana, click on Configuration > Data sources from the Grafana web interface as marked in the screenshot below.
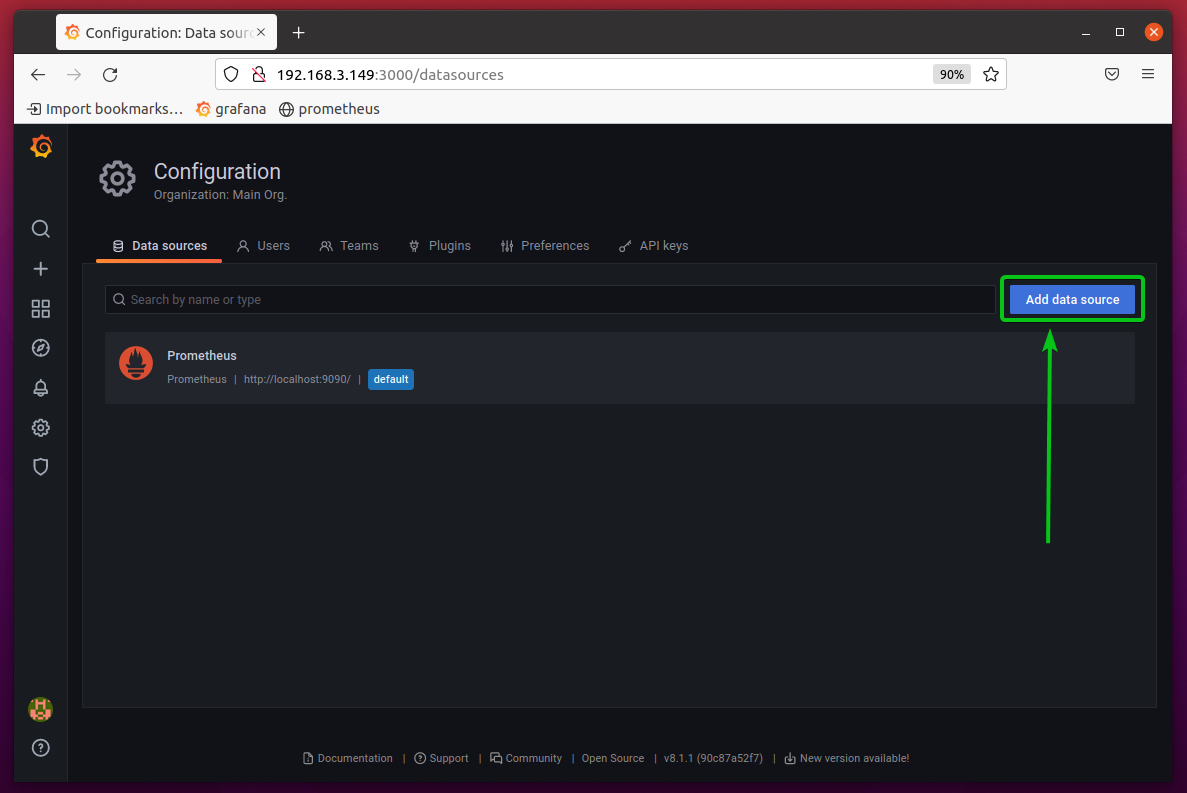
Click on Add data source.
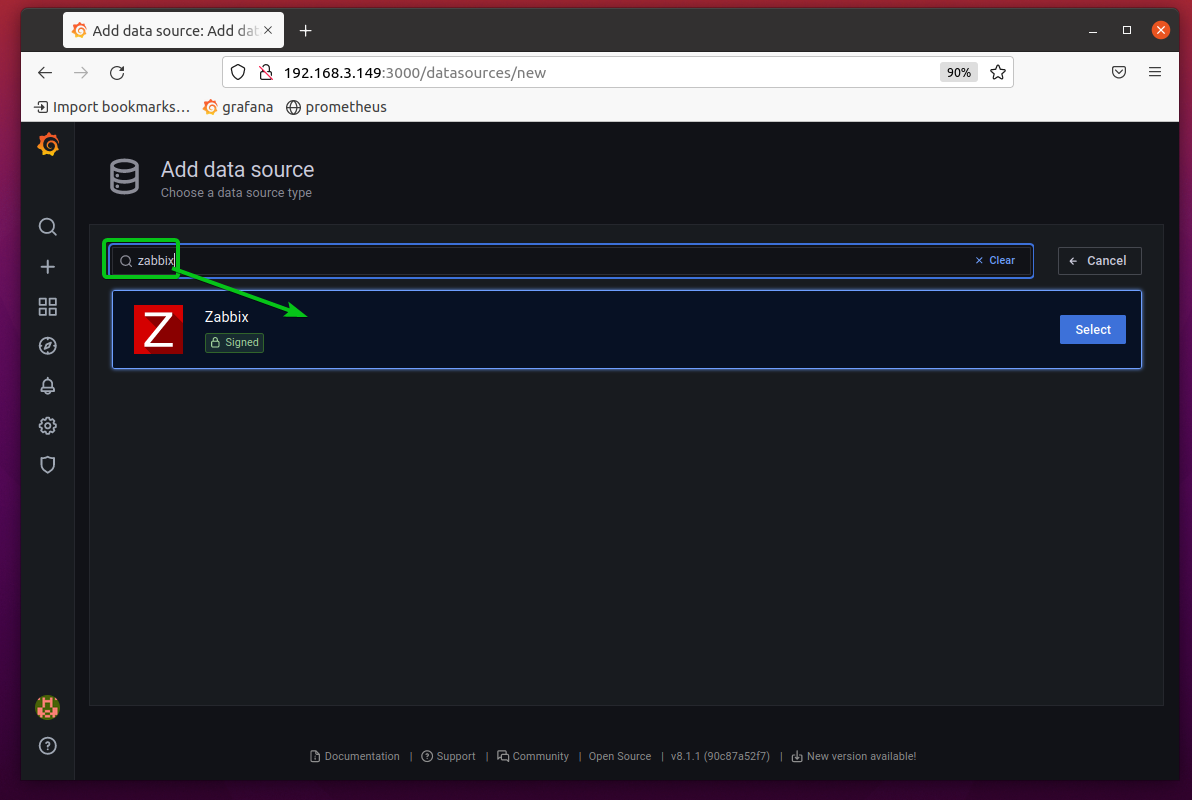
Search for the Zabbix data source and click on it as marked in the screenshot below.
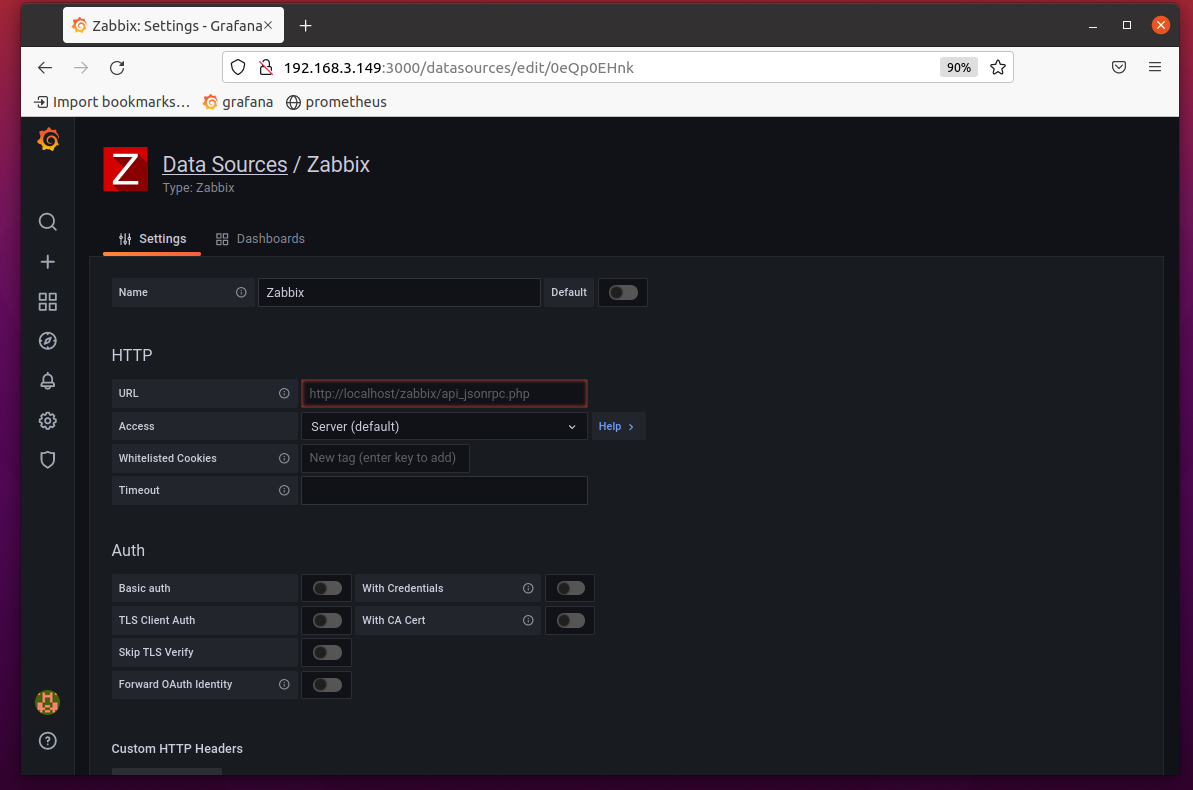
You should see the following page. You have to add your Zabbix server information here.
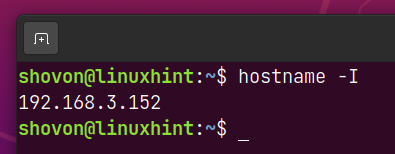
To add your Zabbix server as a data source on Grafana, you need to know the IP address of your Zabbix server. In my case, the IP address of my Zabbix server is 192.168.3.152. It will be different for you. So, make sure to replace it with yours from now on.
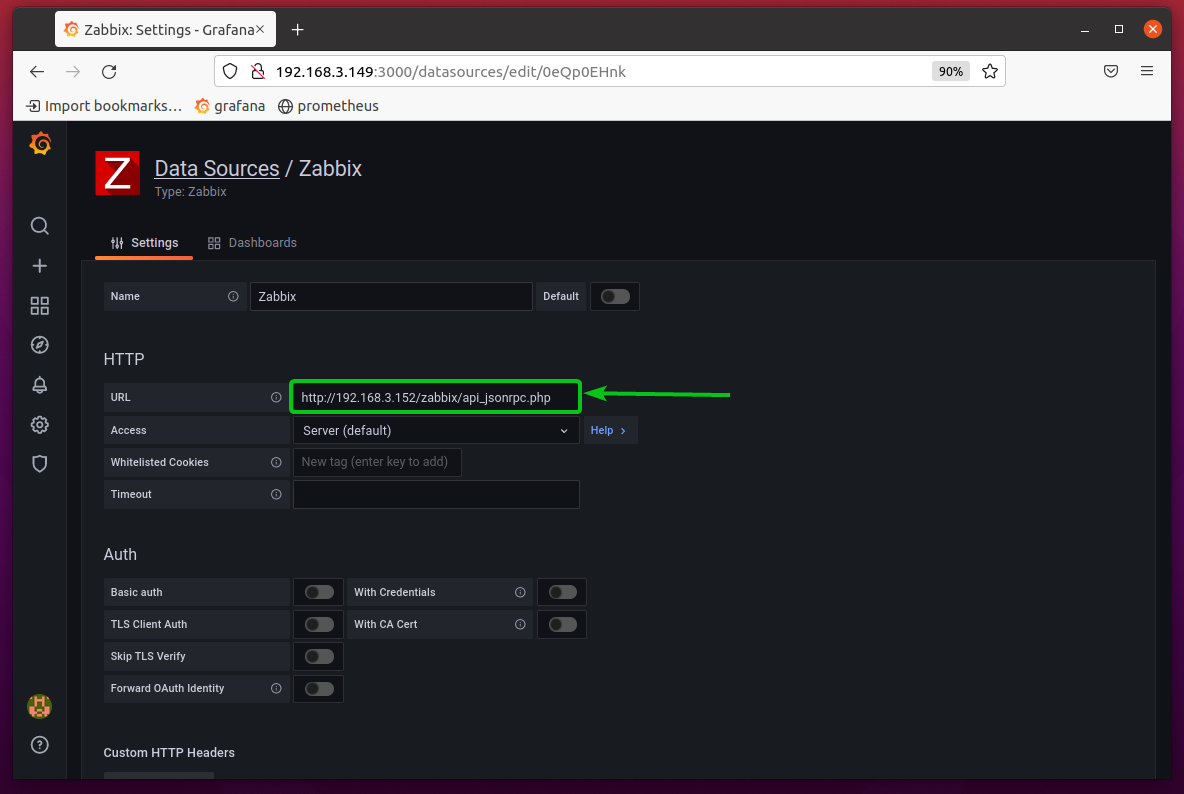
Once you know the IP address of your Zabbix server, type in the following URL in the URL section of Grafana Zabbix Data Source wizard.
http://192.168.3.152/zabbix/api_jsonrpc.php
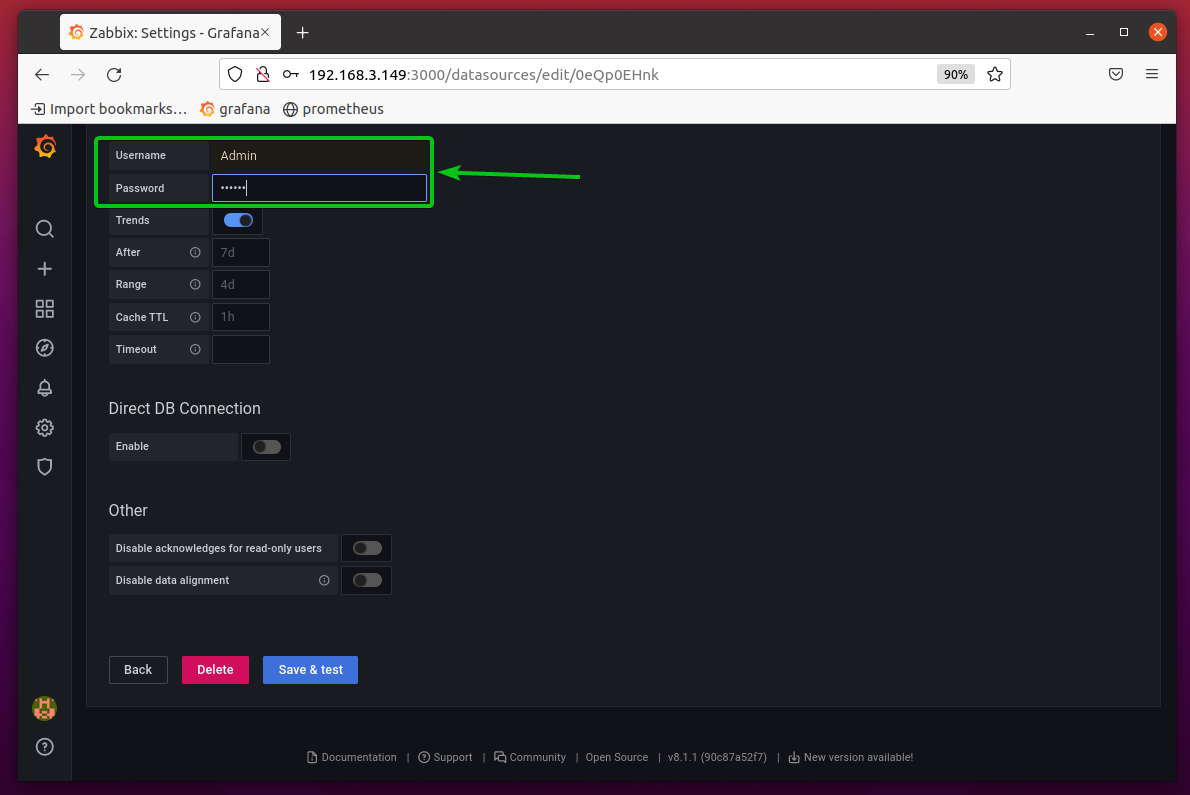
Scroll down a little bit and type in the login username and password of your Zabbix server in the Username and Password section respectively.
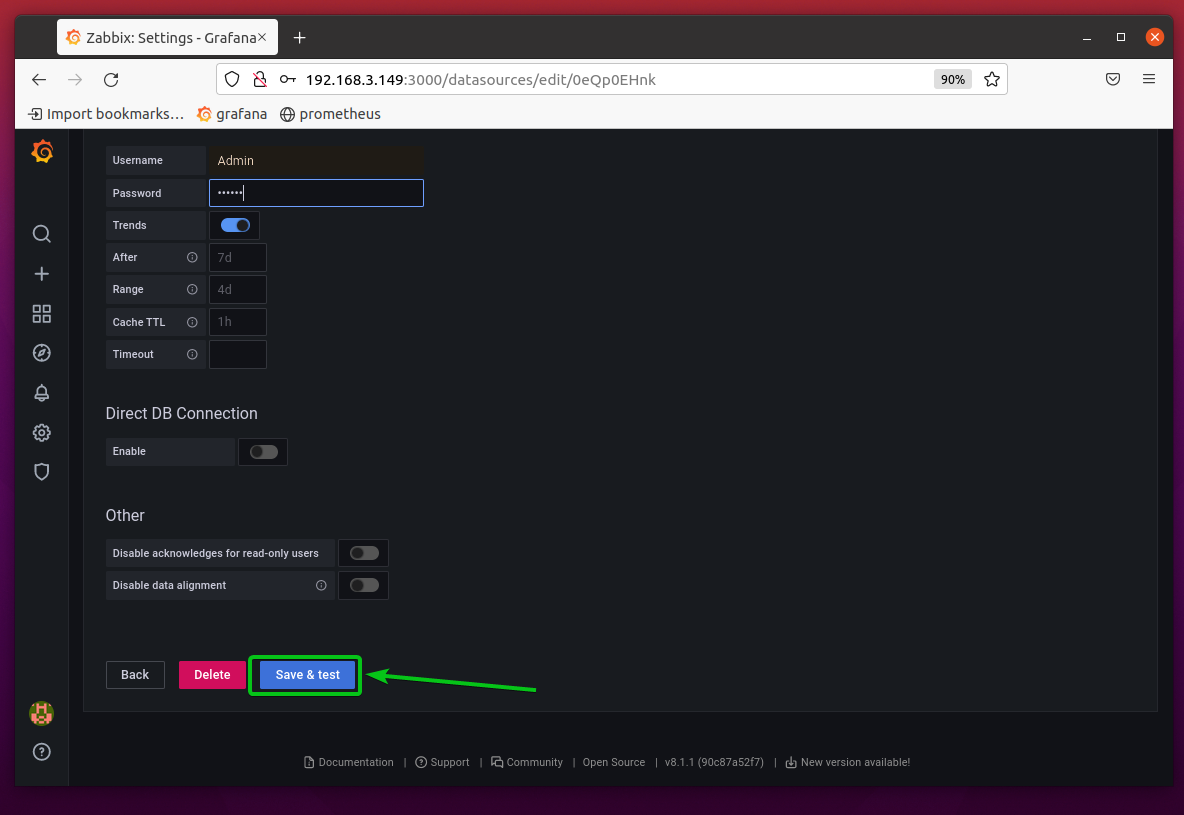
Once you’re done, click on Save & Test as marked in the screenshot below.
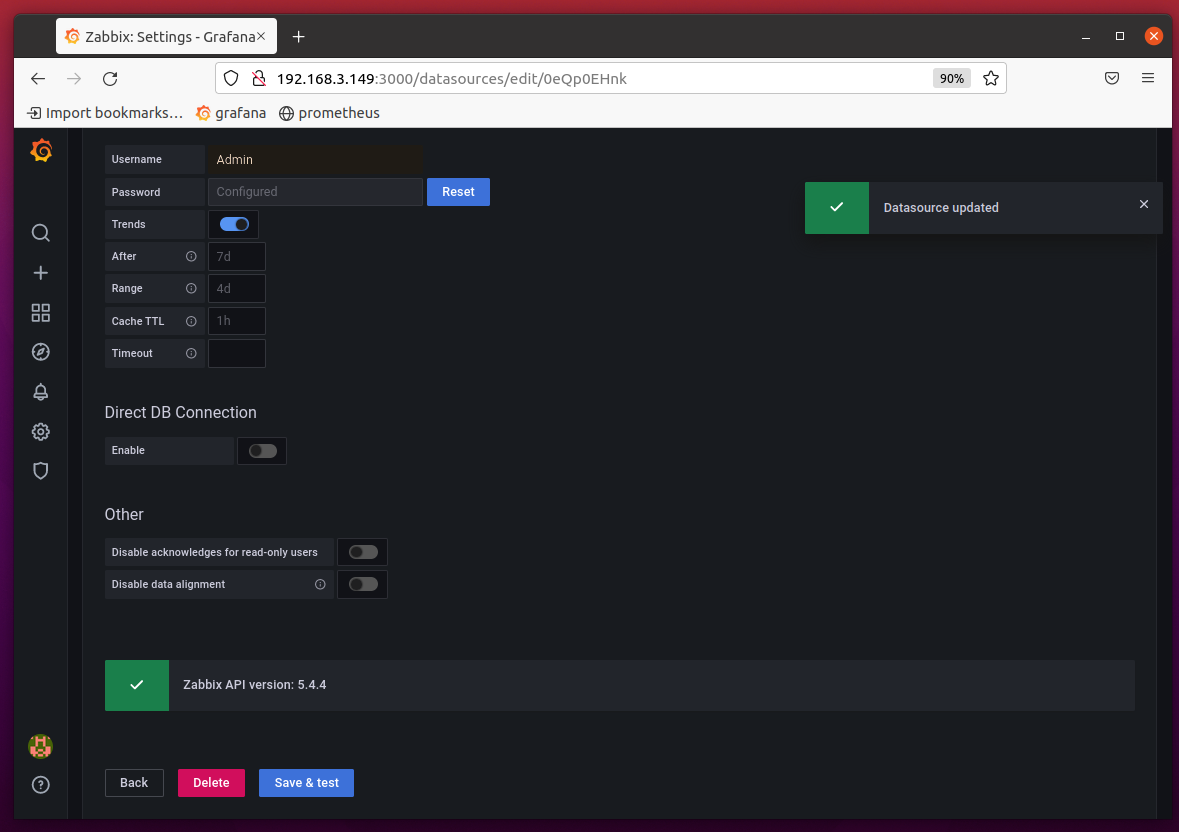
Your Zabbix server should be added to Grafana as a data source.
Monitoring Zabbix with Grafana
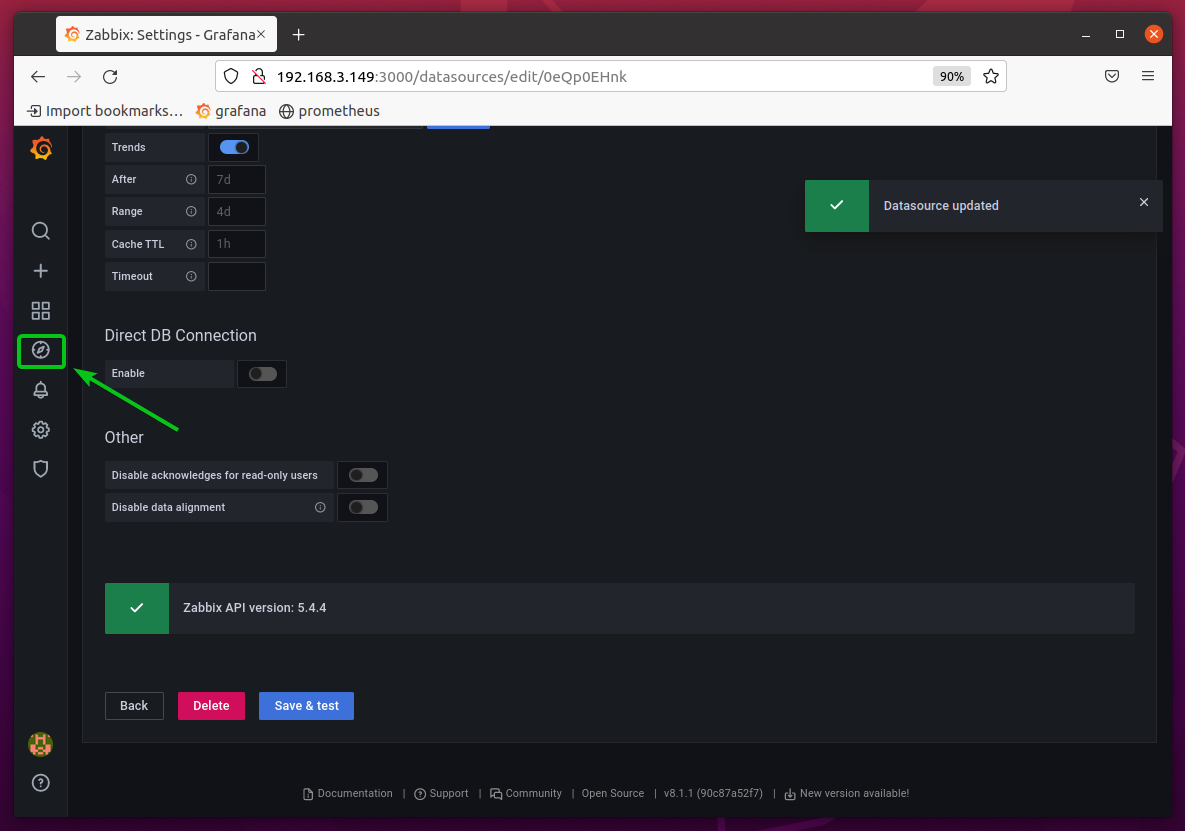
To test whether you can monitor Zabbix with Grafana, click on the Explorer icon ( ) of Grafana as marked in the screenshot below.
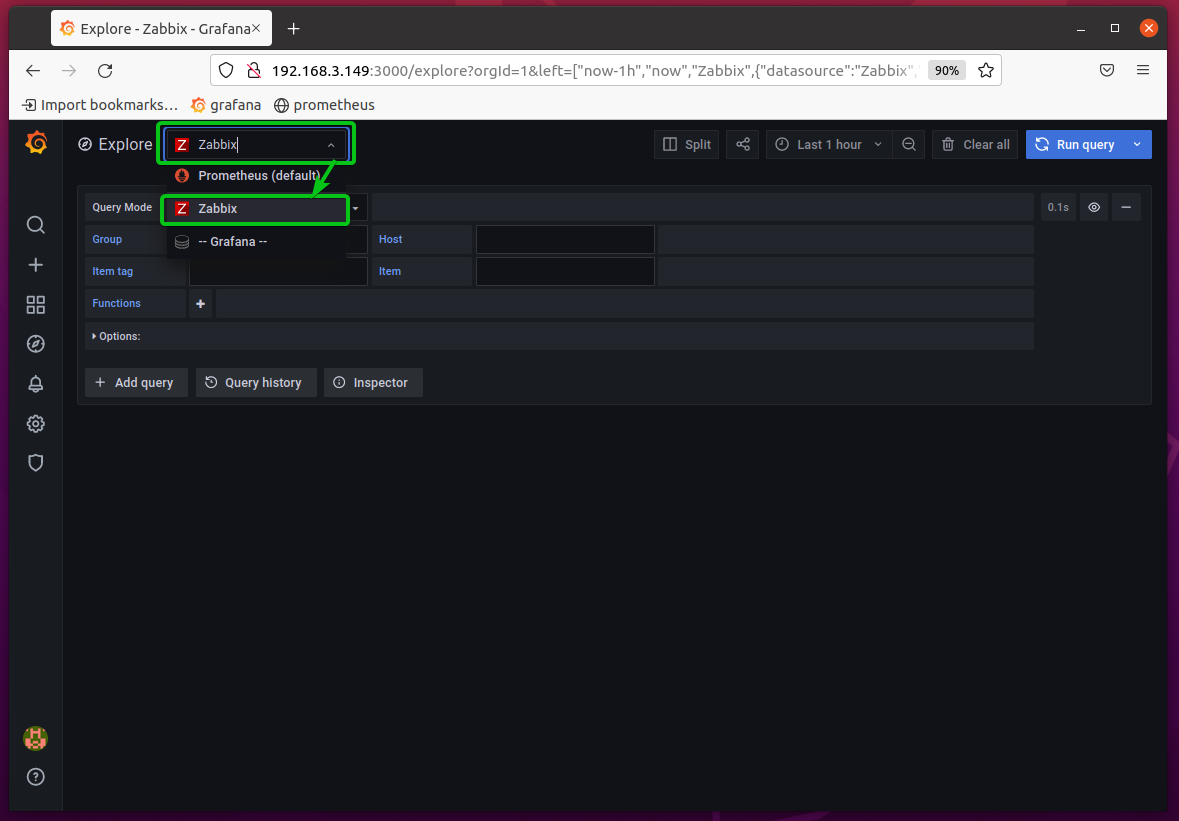
Select Zabbix from the Explore dropdown menu as marked in the screenshot below.
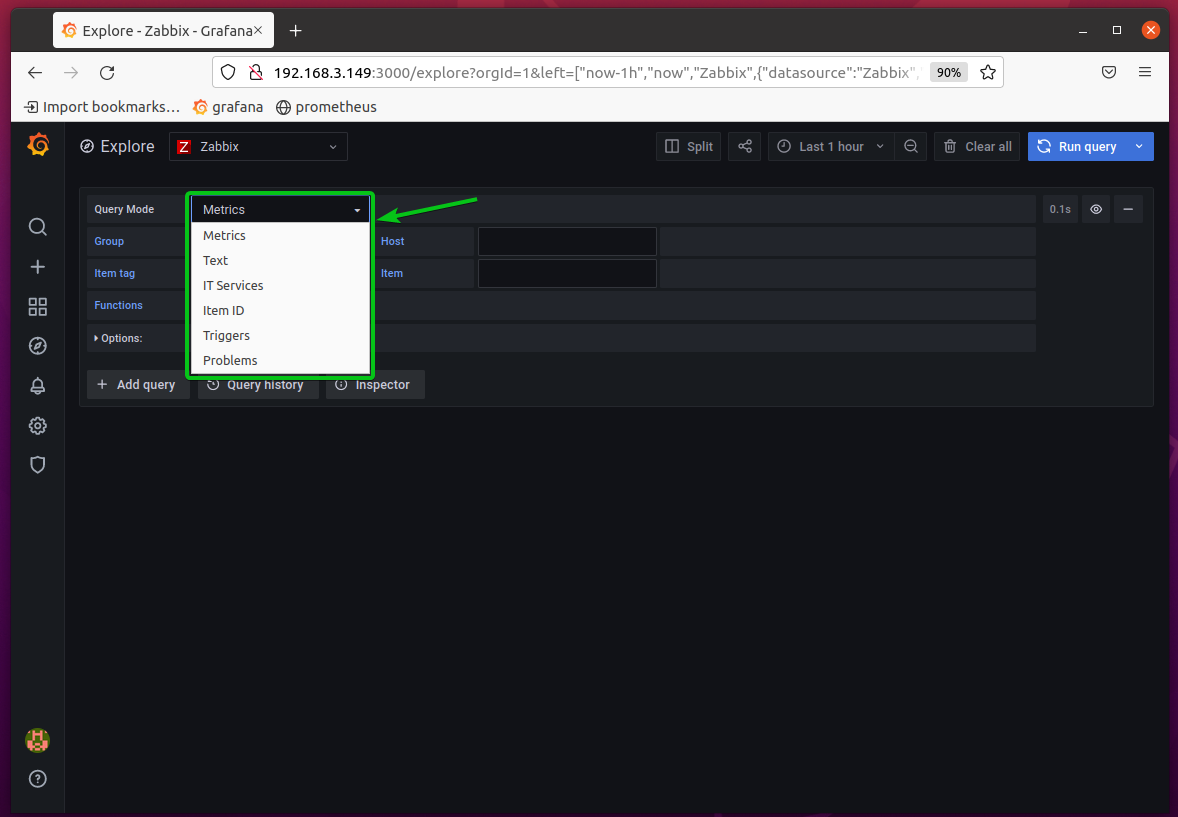
Now, select the type of data you want to query from Zabbix from the Query Mode dropdown menu as marked in the screenshot below.
I will select the Metrics type.
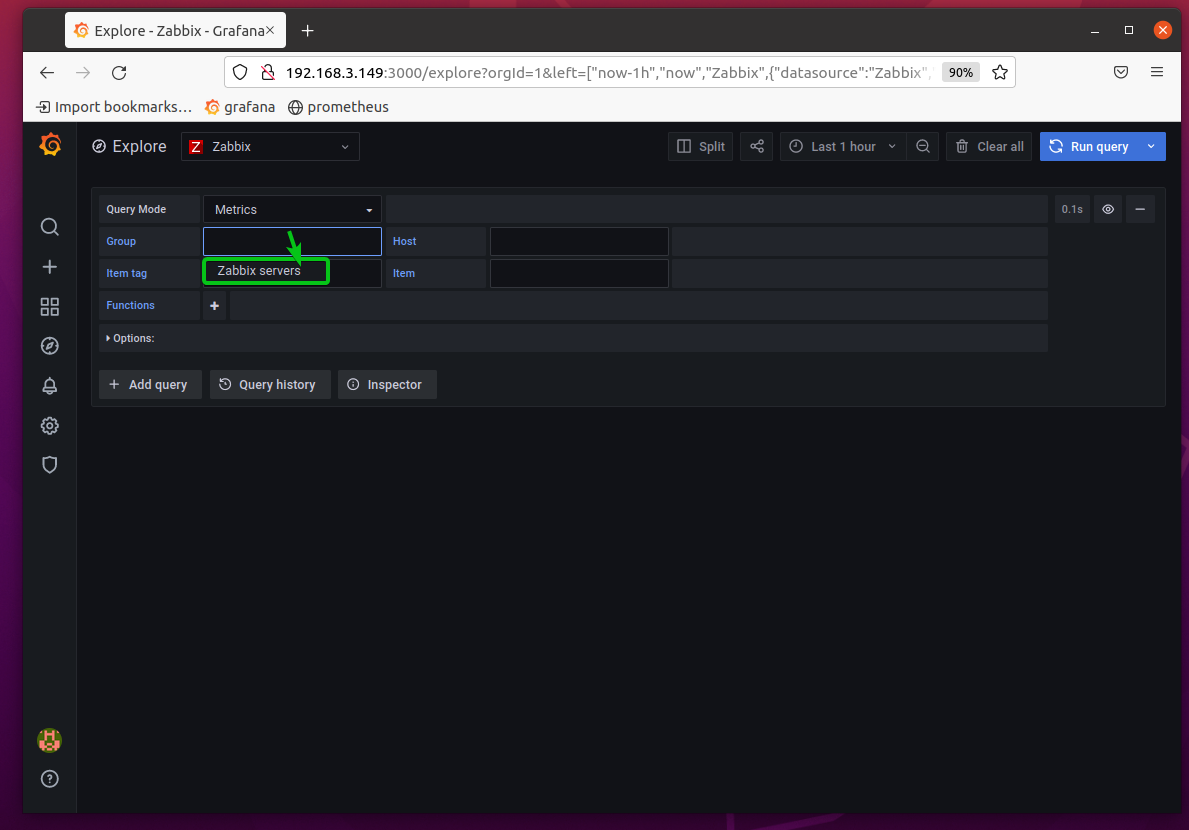
Select your desired Zabbix group from the Group section. I will select the default Zabbix servers group.
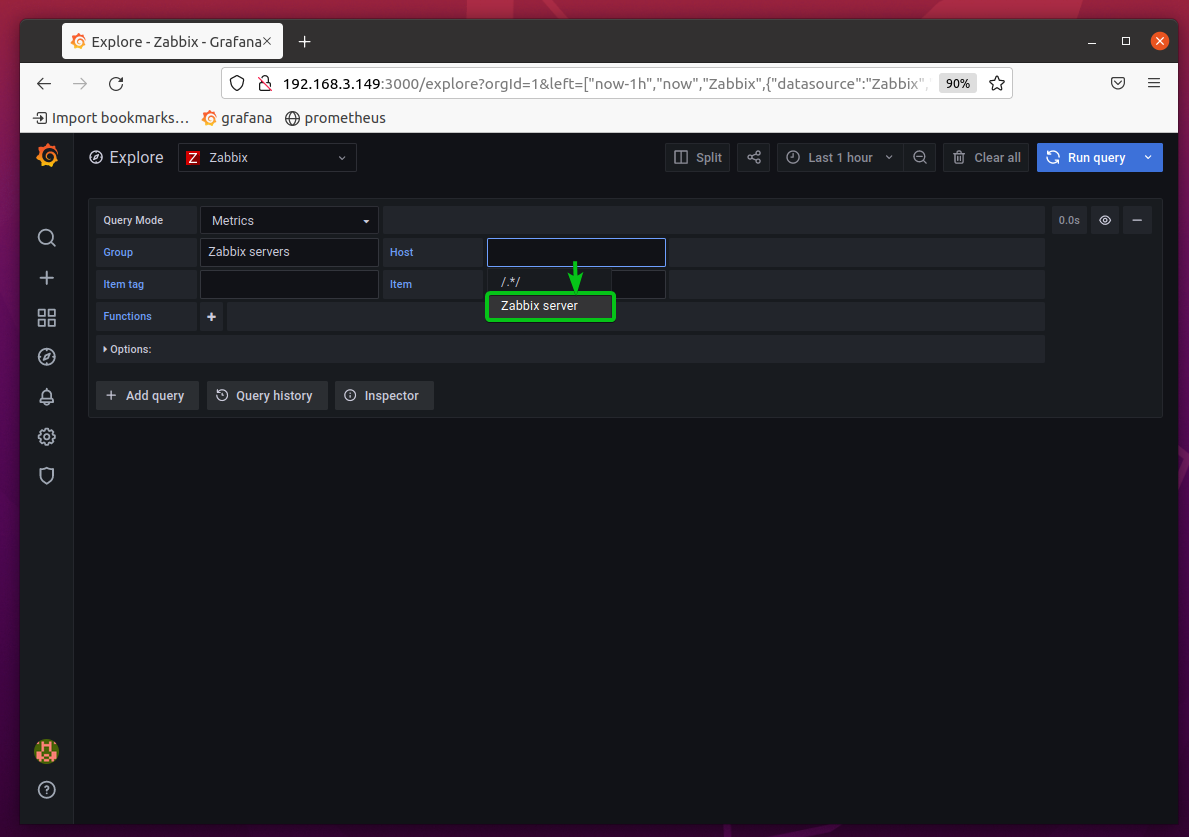
Select your Zabbix host from the Host section. I will select the Zabbix server host.
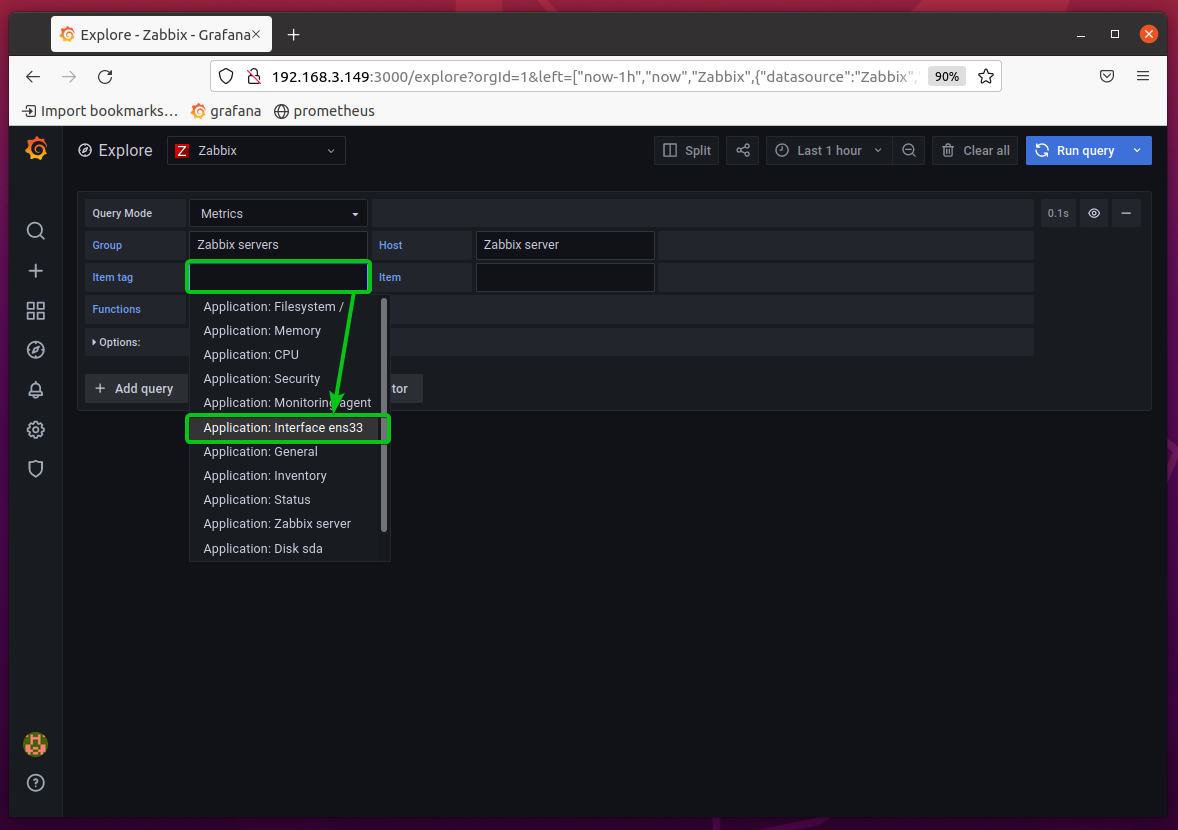
Select an item tag that you want to monitor from the Item tag section.
I will select the item tag Application: Interface ens33 in this example. This item tag will let you monitor the network interface ens33.
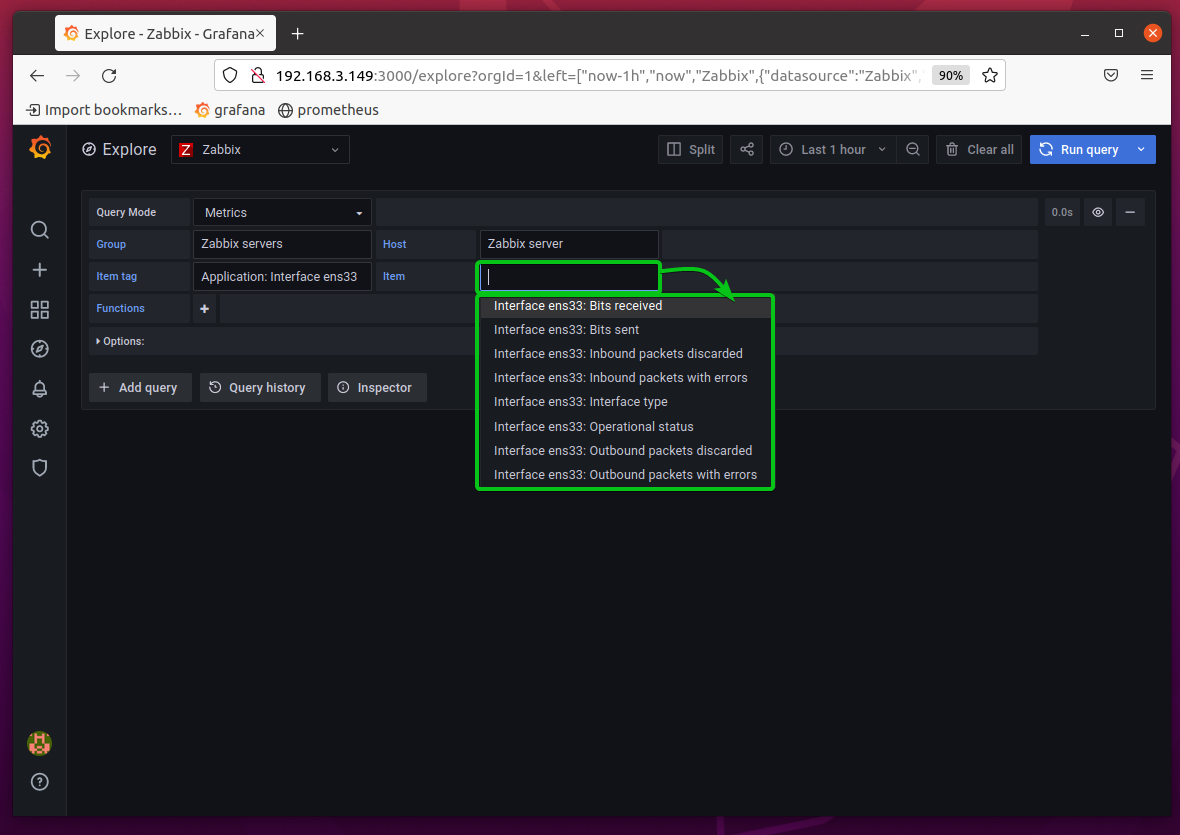
Now, select the item that you want to monitor from the Item section.
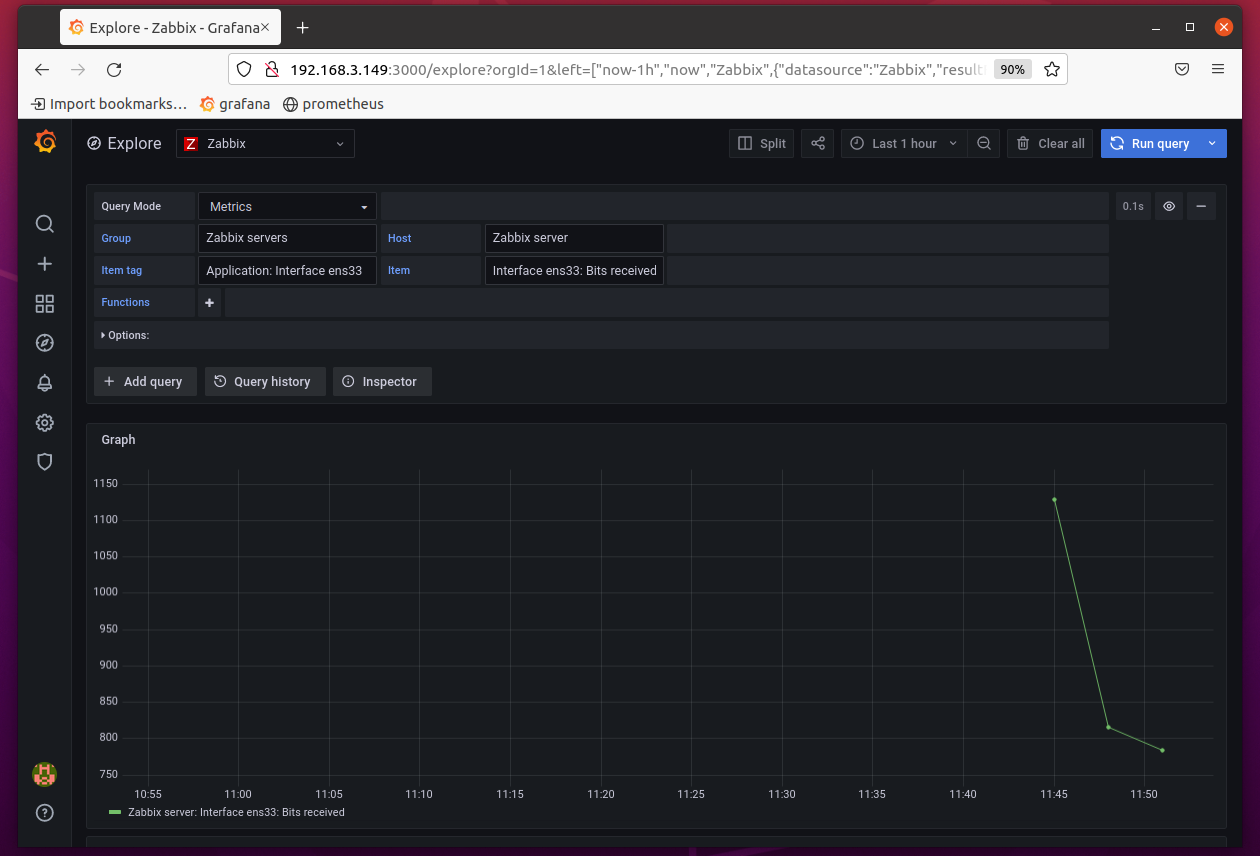
If you have selected the Item tag Application: Interface ens33 like I did, you can select the Item Interface ens33: Bit received to monitor the download speed of the network interface ens33.
You should see a graph of the download speed of the network interface ens33.
You can learn to use the Zabbix data source to monitor your Zabbix server with Grafana from the Explore page of Grafana. This tool is very helpful.
Creating a Basic Zabbix Grafana Dashboard
In this section, I am going to show you how to create a basic Grafana dashboard using Zabbix as a data source to monitor the network download and upload speed of the Zabbix server.
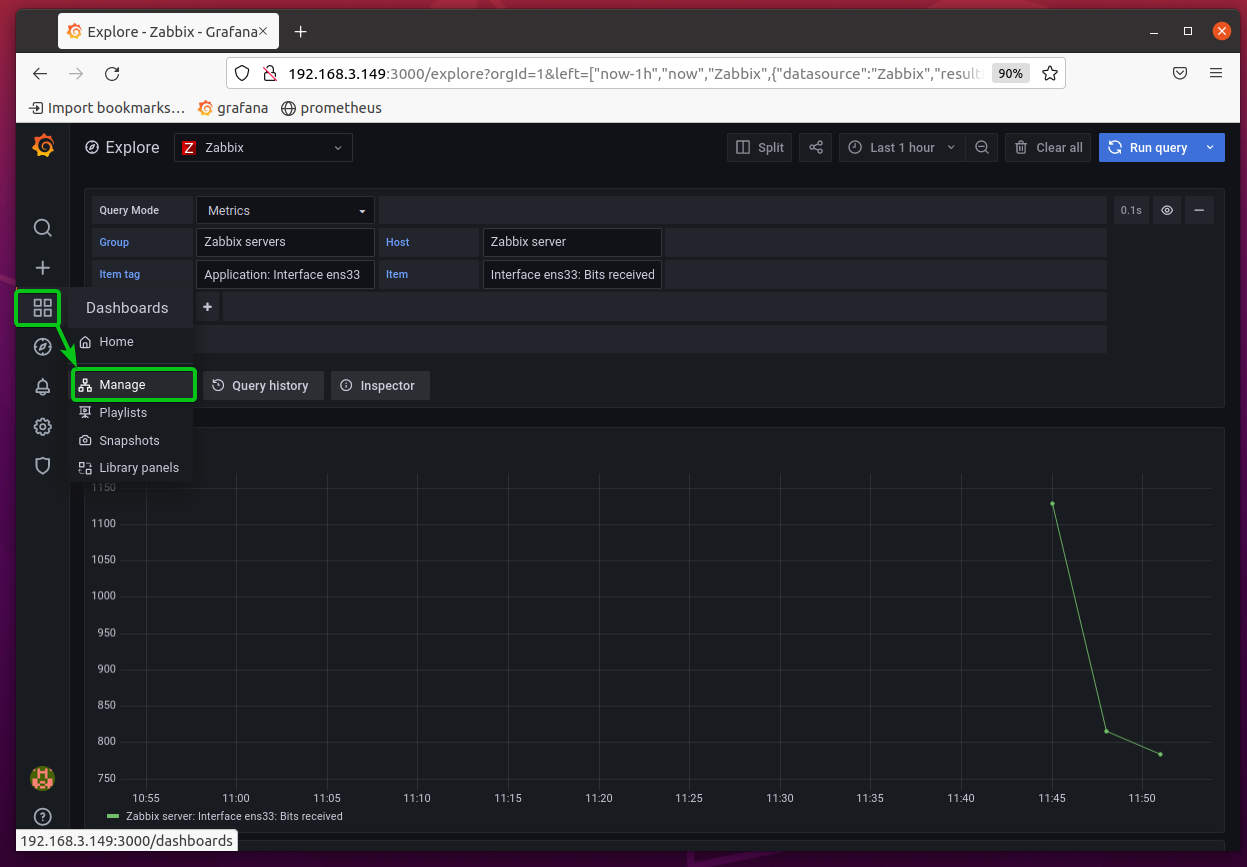
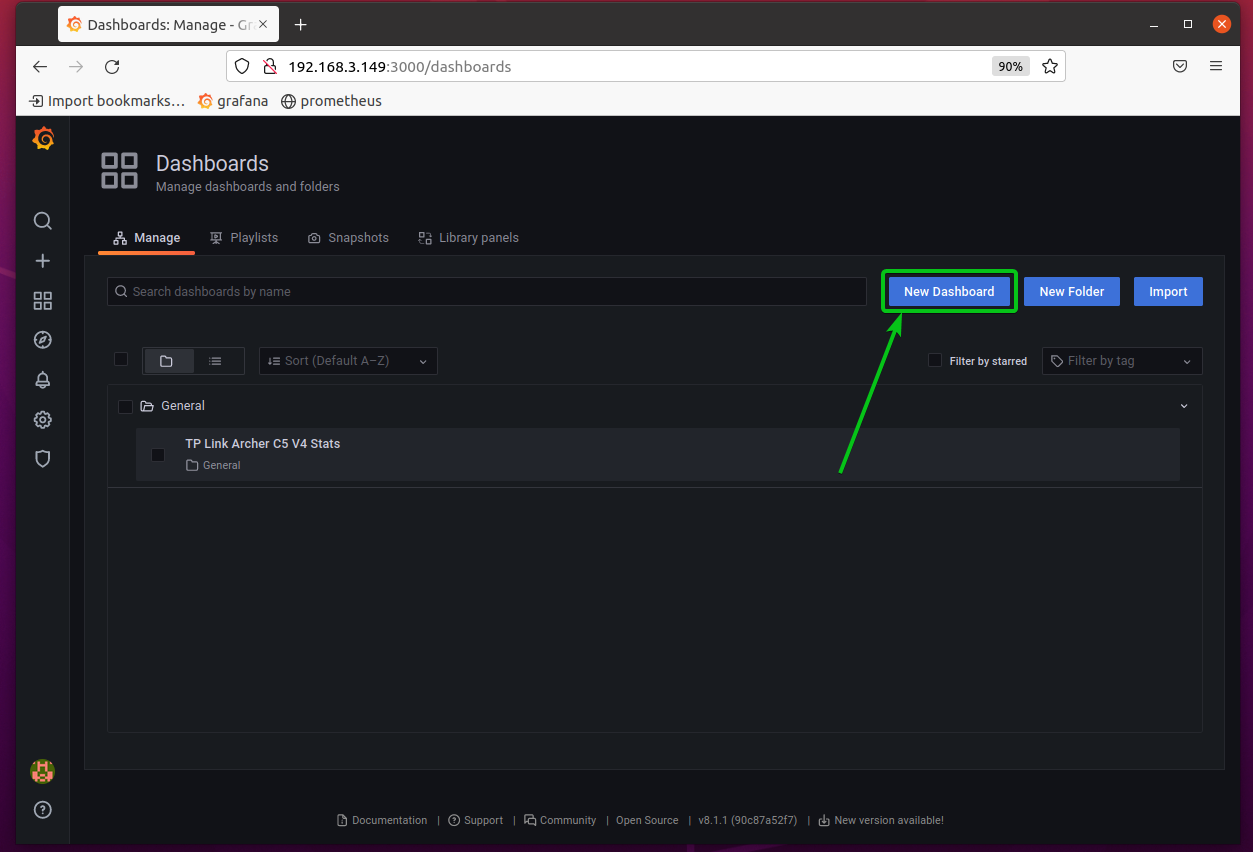
To create a new Grafana dashboard, click on Dashboards > Manage from the Grafana web interface.
Click on New Dashboard.
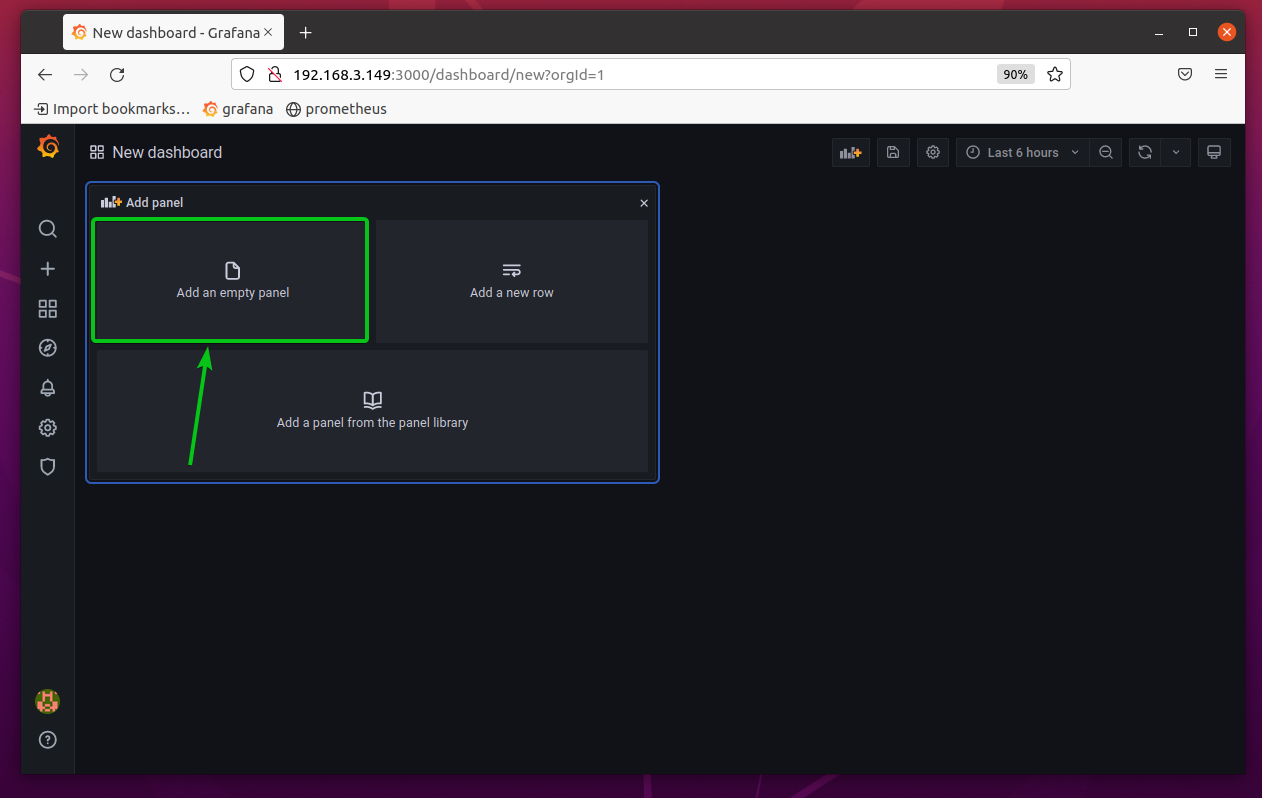
A new Dashboard should be created.
Click on Add an empty panel to add a new panel to the Dashboard.
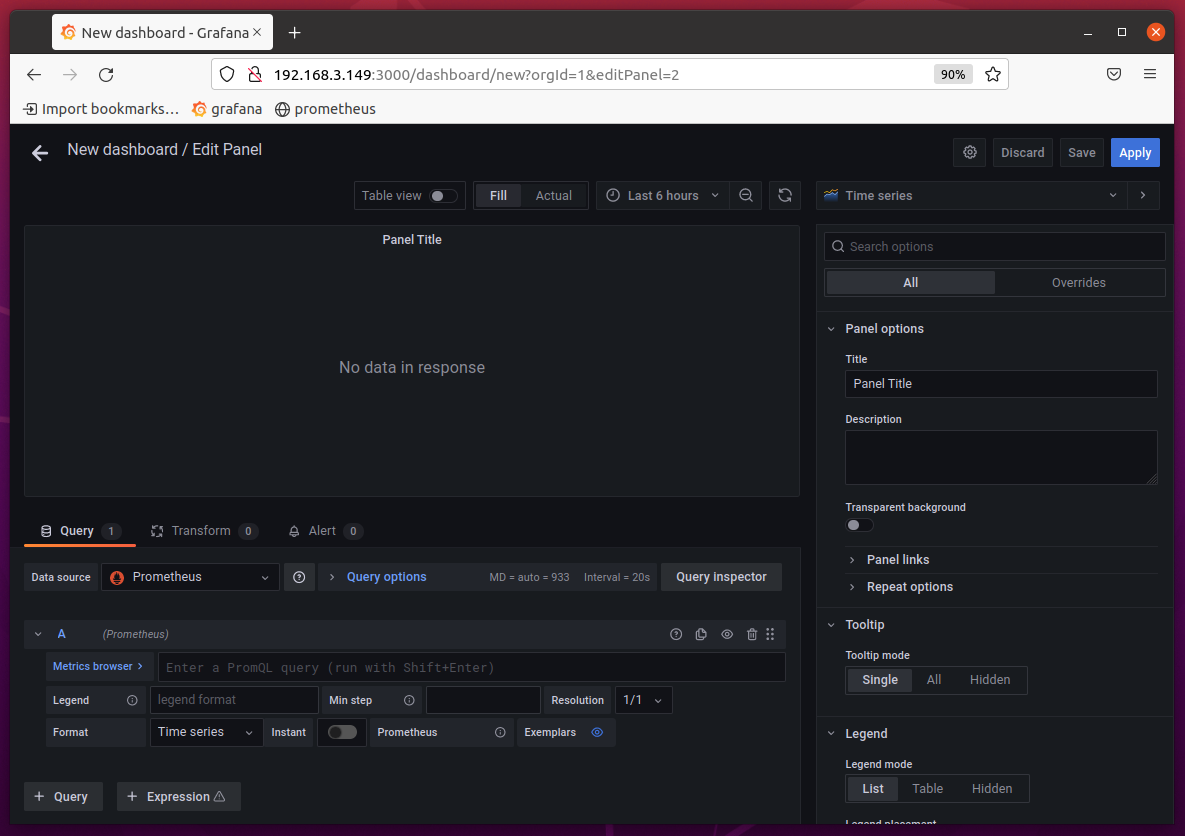
The Grafana panel editor should be displayed. You can configure your Grafana panel from here.
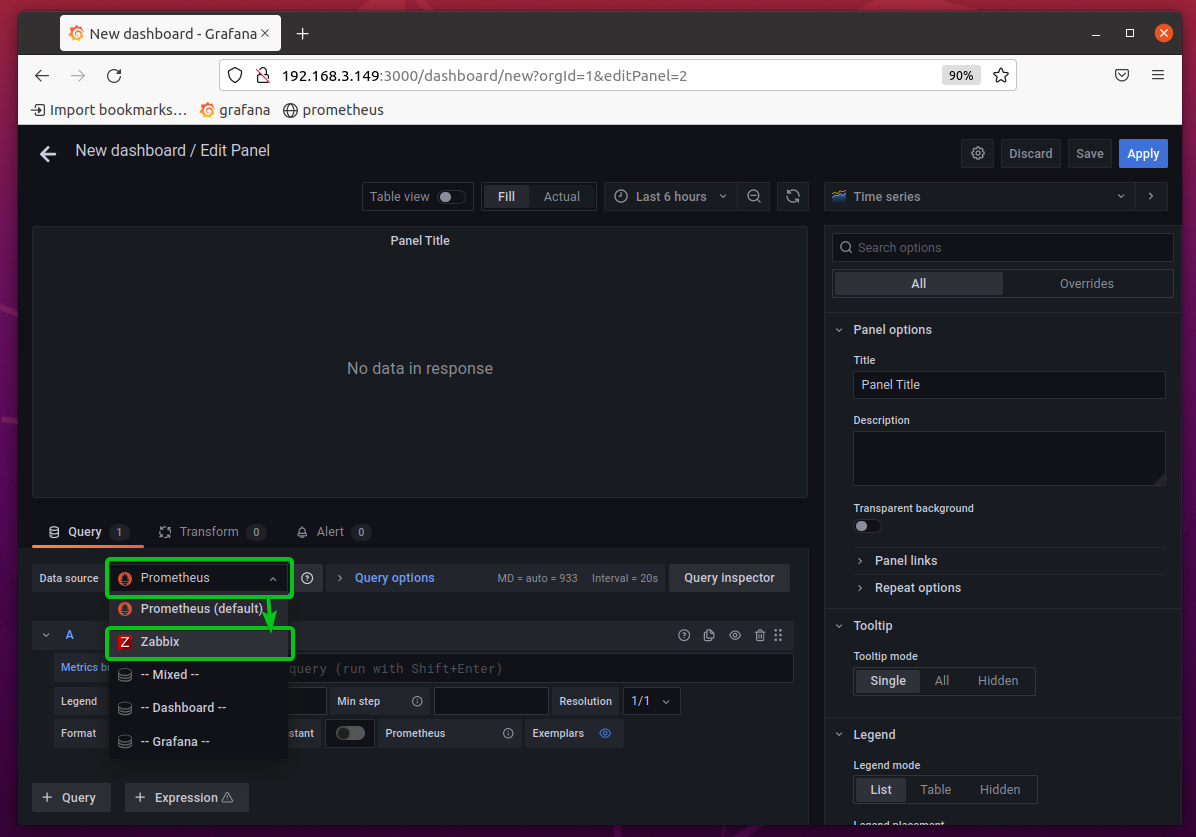
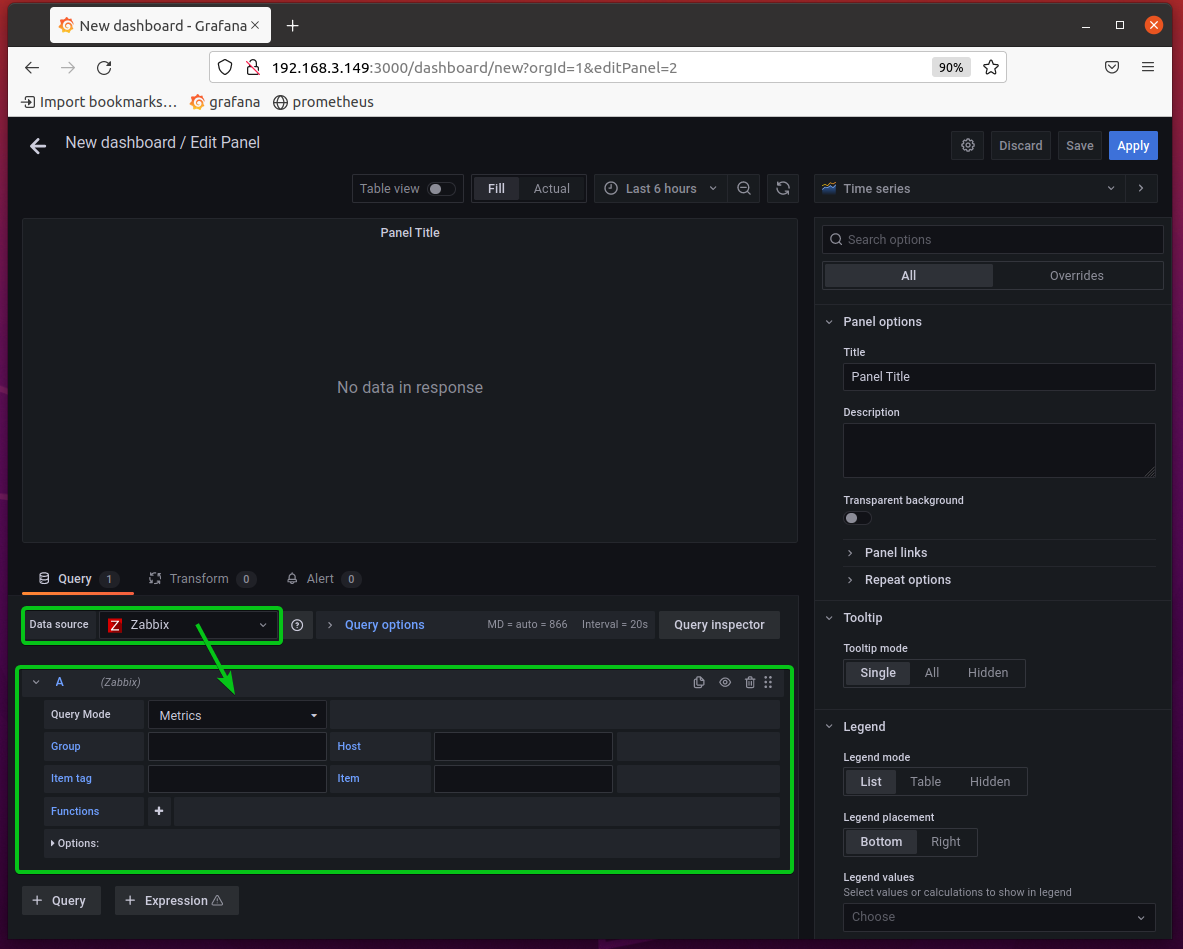
First, change the data source to Zabbix from the Data source dropdown menu as marked in the screenshot below.
Now, you should be able to query data from the Zabbix data source.
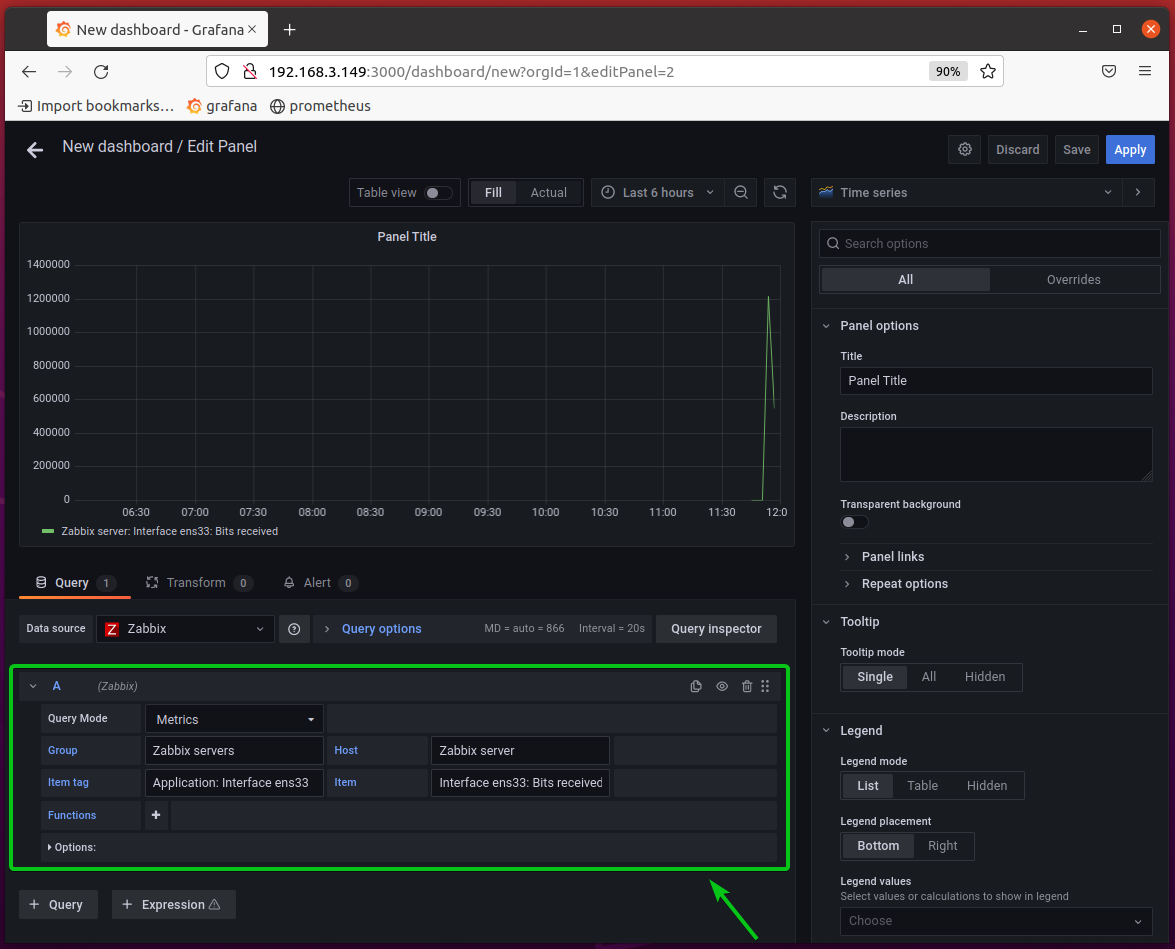
To monitor the download speed of your Zabbix server, select the query settings as marked in the screenshot below.
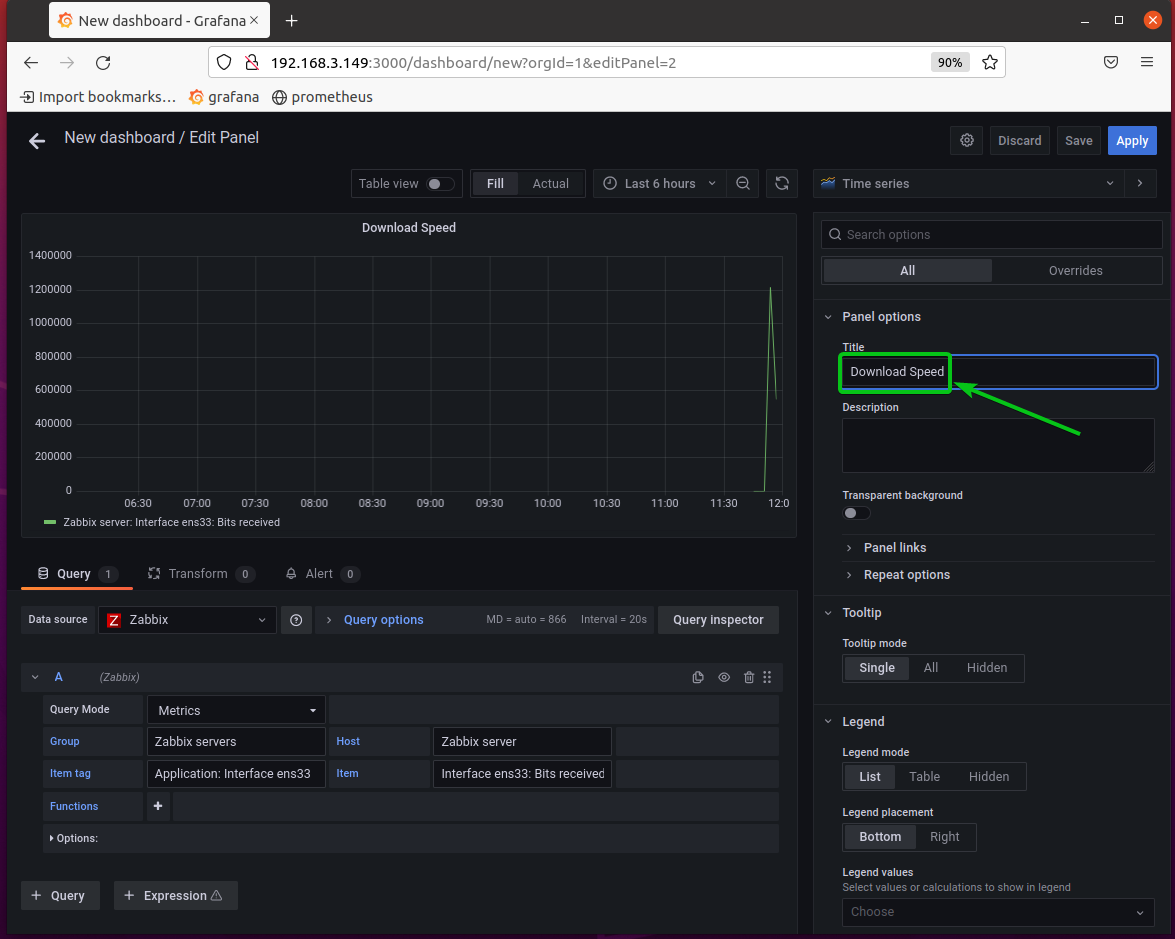
Type in the title Download Speed in the Title section as marked in the screenshot below.
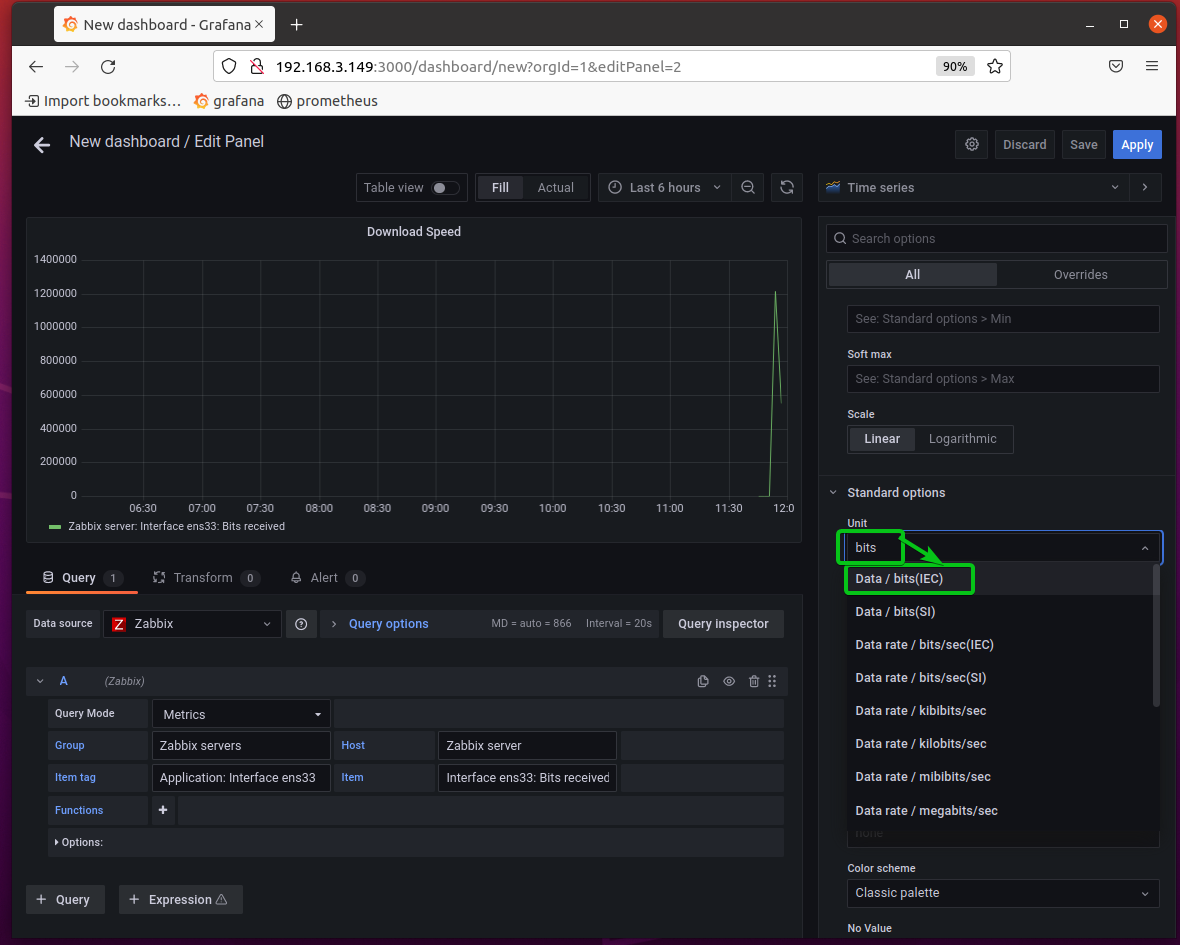
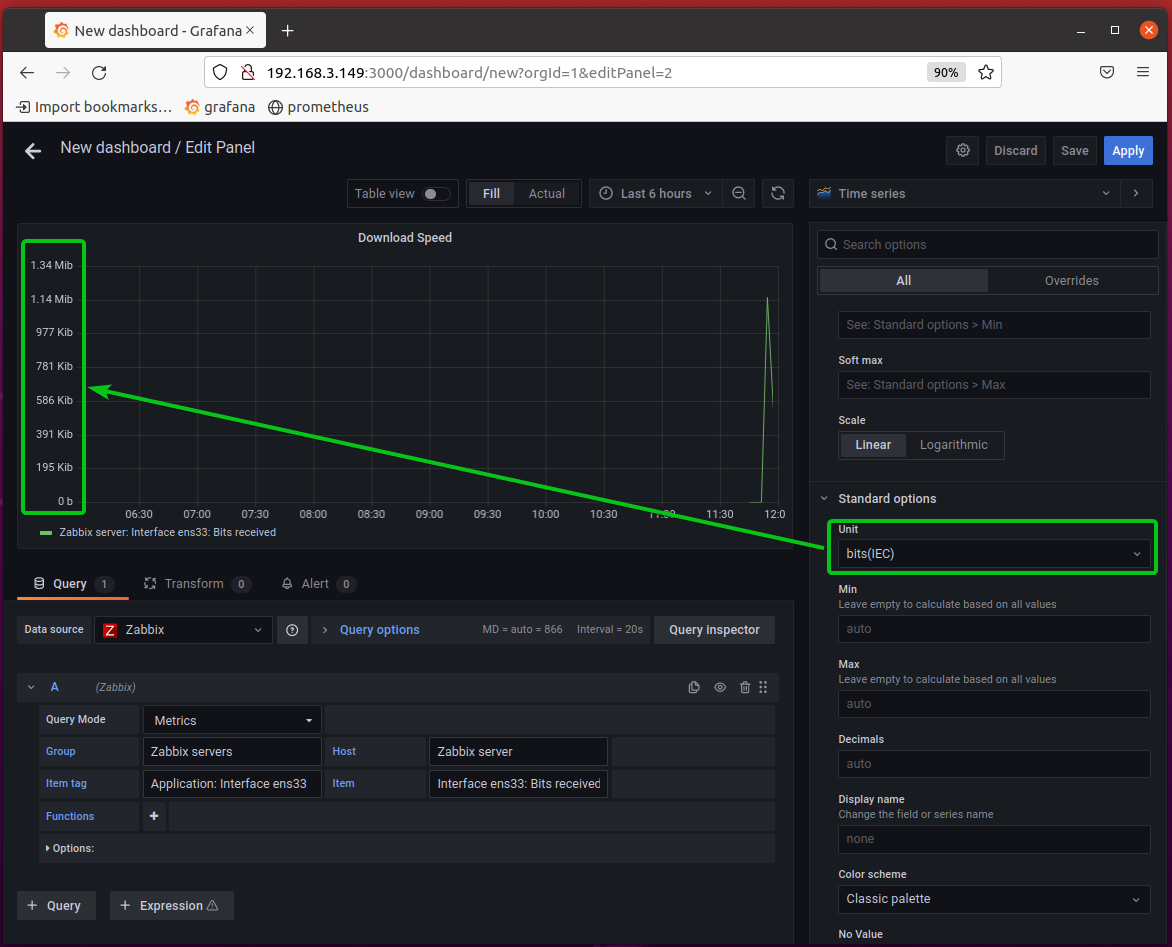
Select the unit Data / bits(IEC) from the Unit section as marked in the screenshot below.
The download speed graph should display the correct data unit as you can see in the screenshot below.
You can do many customizations to your Grafana panel. You may read the article How Do I Connect Grafana with Prometheus? to learn more.
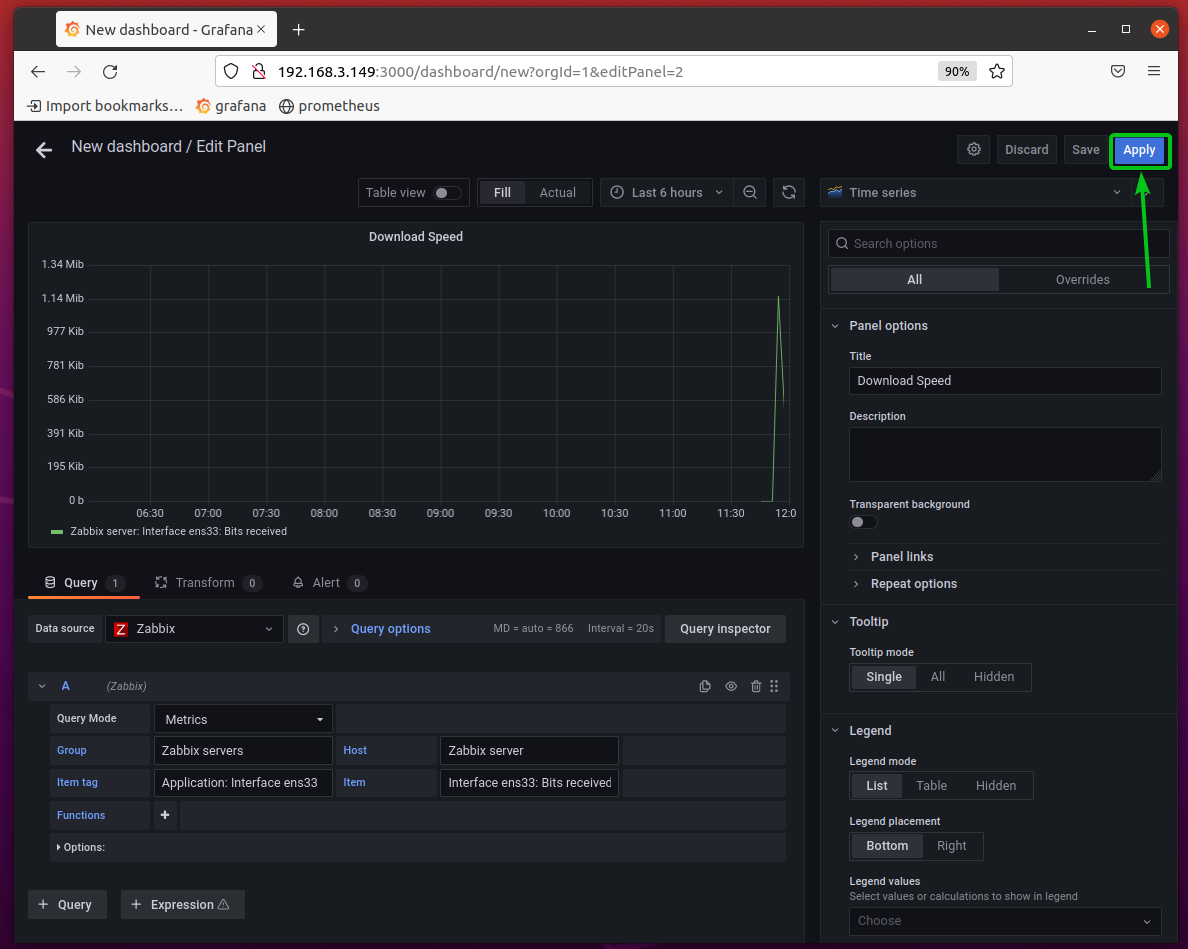
Once you’re happy with the result, click on Apply to add the panel to the dashboard.
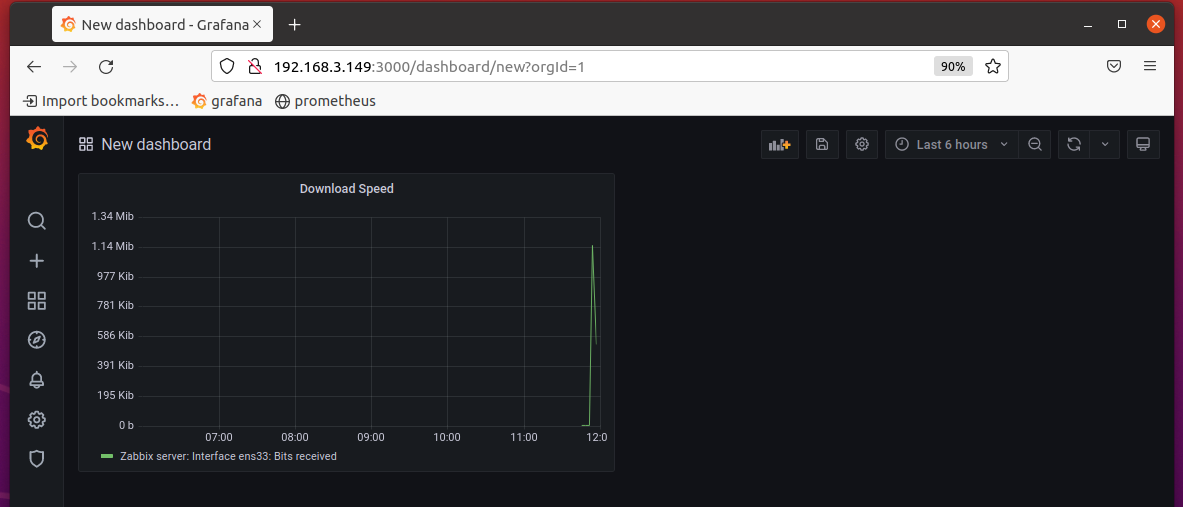
The Download Speed panel should be added to the dashboard.
Now, let’s create another panel to monitor the upload speed of the Zabbix server.
As the upload speed monitoring panel will be the same as the Download Speed panel, you can clone it and change a few settings to easily monitor the upload speed of your Zabbix server.
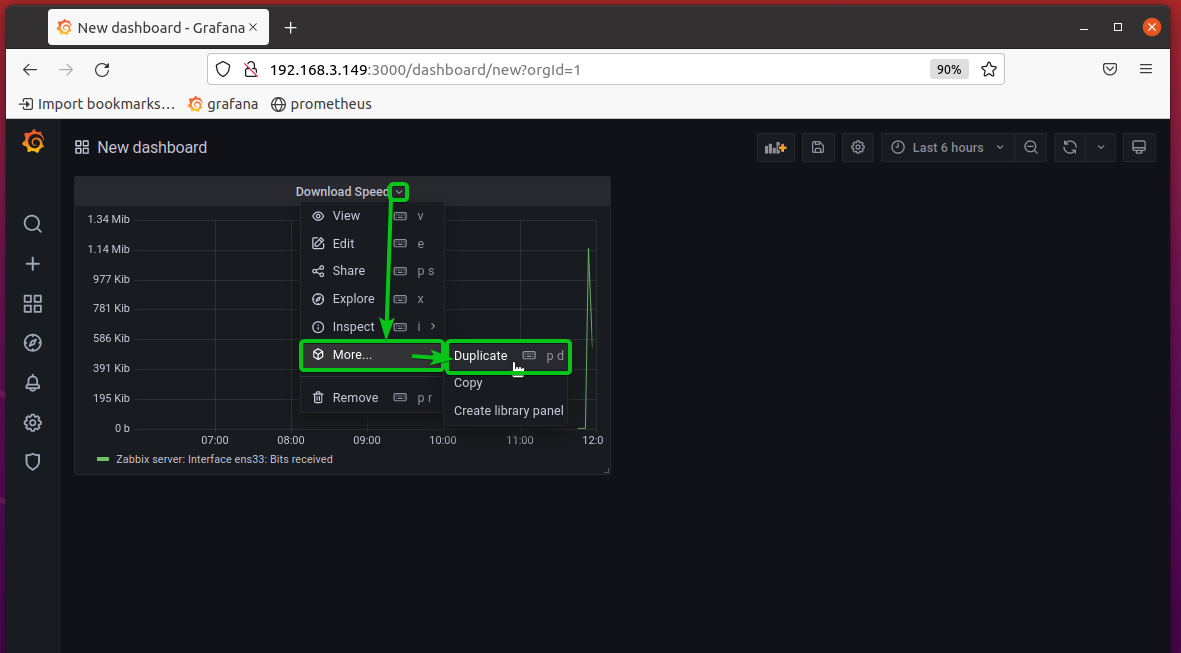
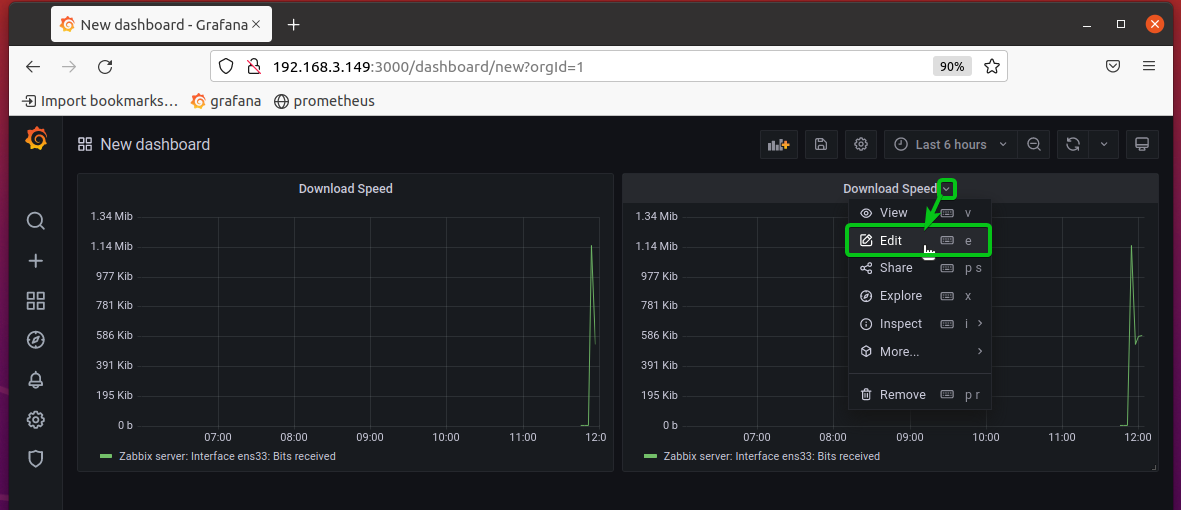
To clone the Download Speed panel, click on the down arrow of the panel and click on More… > Duplicate as marked in the screenshot below.
The Download Speed panel should be cloned. Now, click on the down arrow icon of the cloned Download Speed panel and click on Edit as marked in the screenshot below.
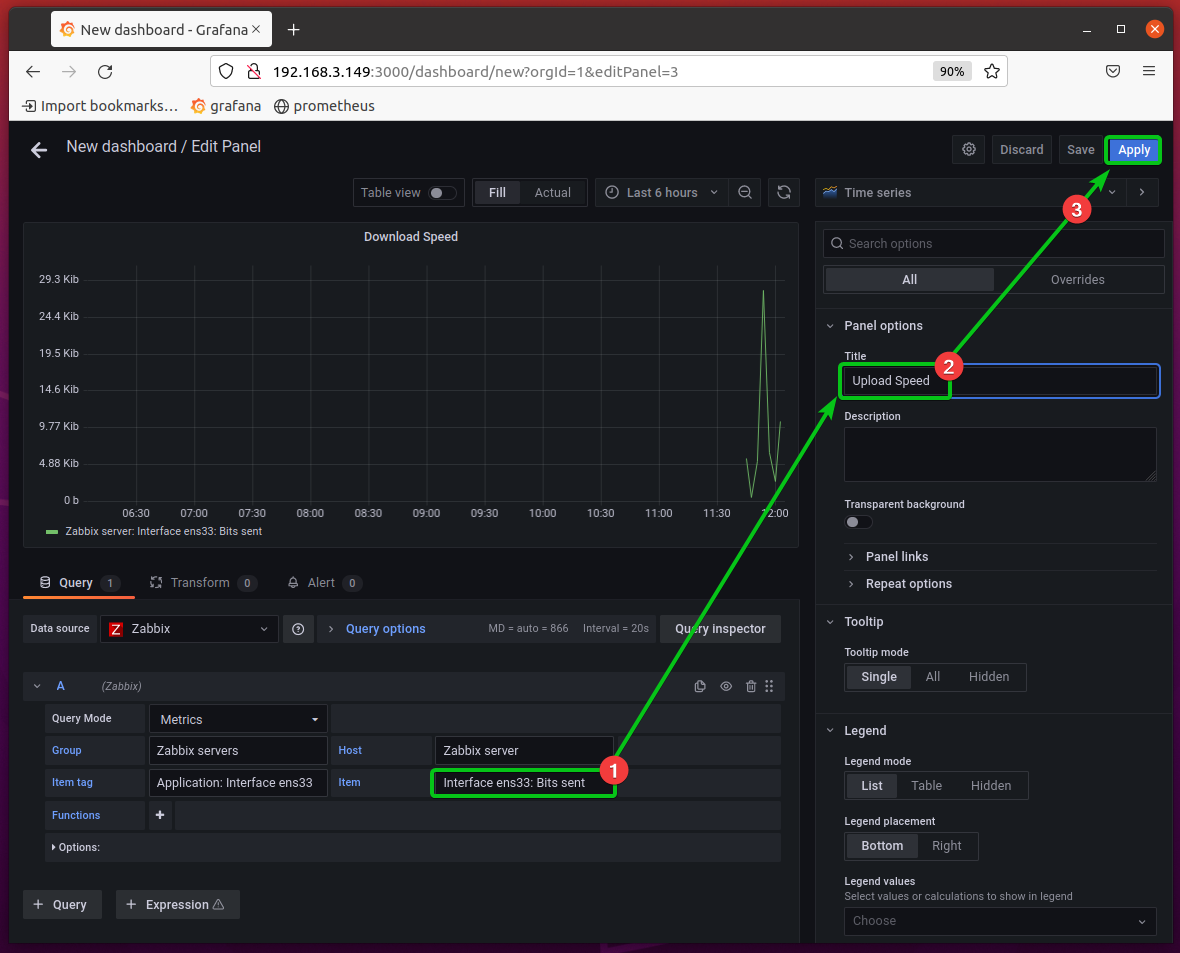
The cloned Download Speed panel should be opened with the Grafana panel editor.
Change the Item to Interface ens33: Bits sent, change the title to Upload Speed, and click on Apply for the changes to take effect.
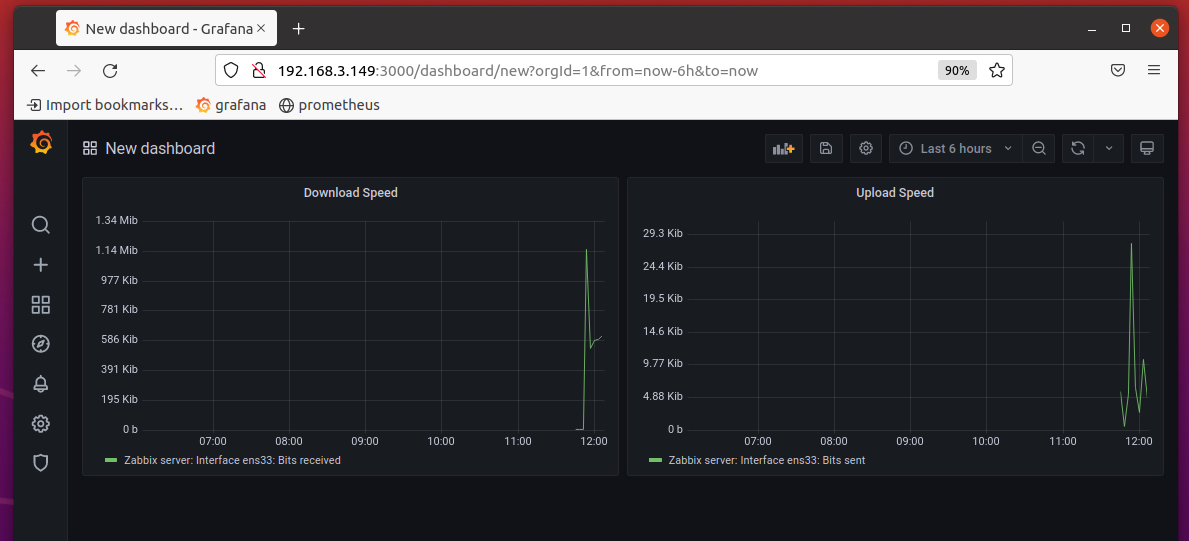
The changes should be saved.
The Upload Speed panel should monitor the upload speed of your Zabbix server.
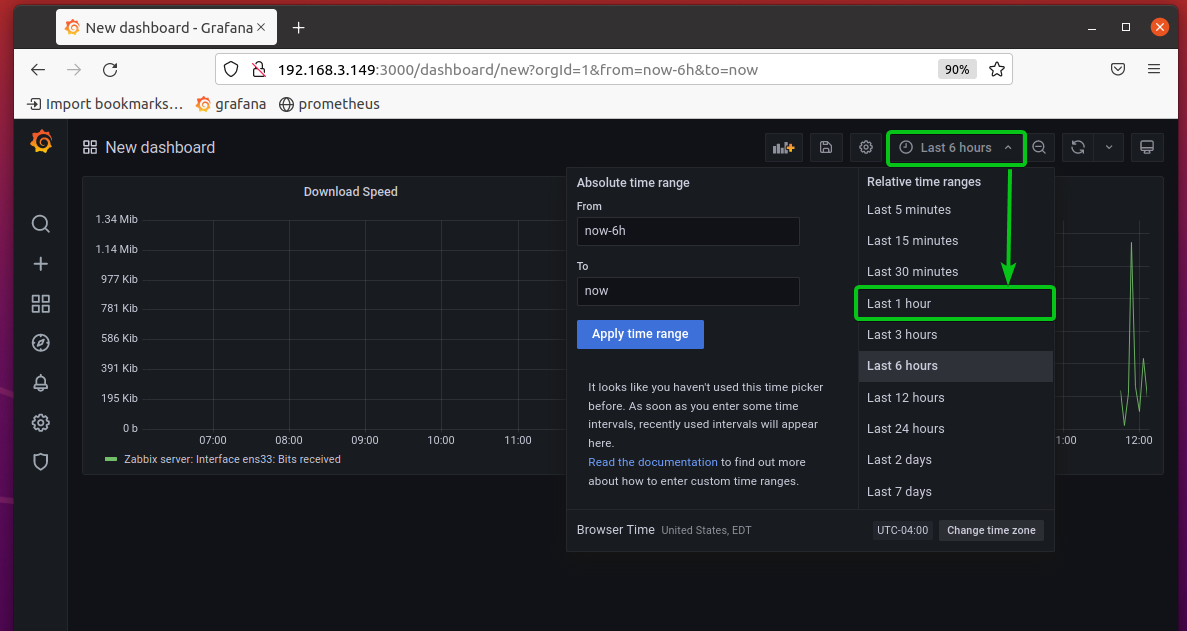
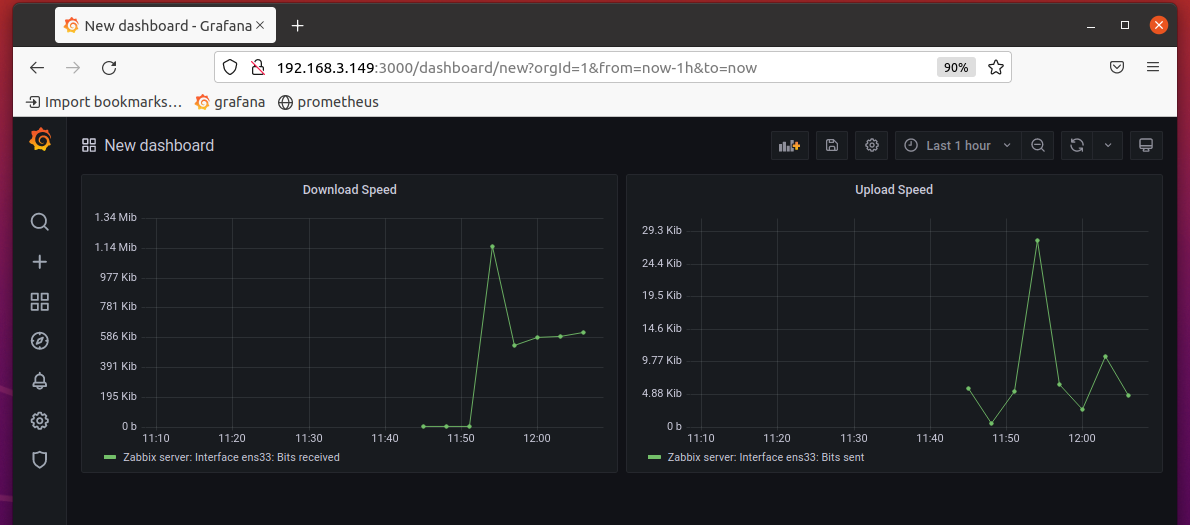
By default, the Grafana dashboard will show the download and upload speed of your Zabbix server for the Last 6 hours. You can change the graph timeline to Last 1 hour to only monitor the download and upload speed of your Zabbix server for the last hour.
As you can see, the download and upload speed is displayed for the last 1 hour.
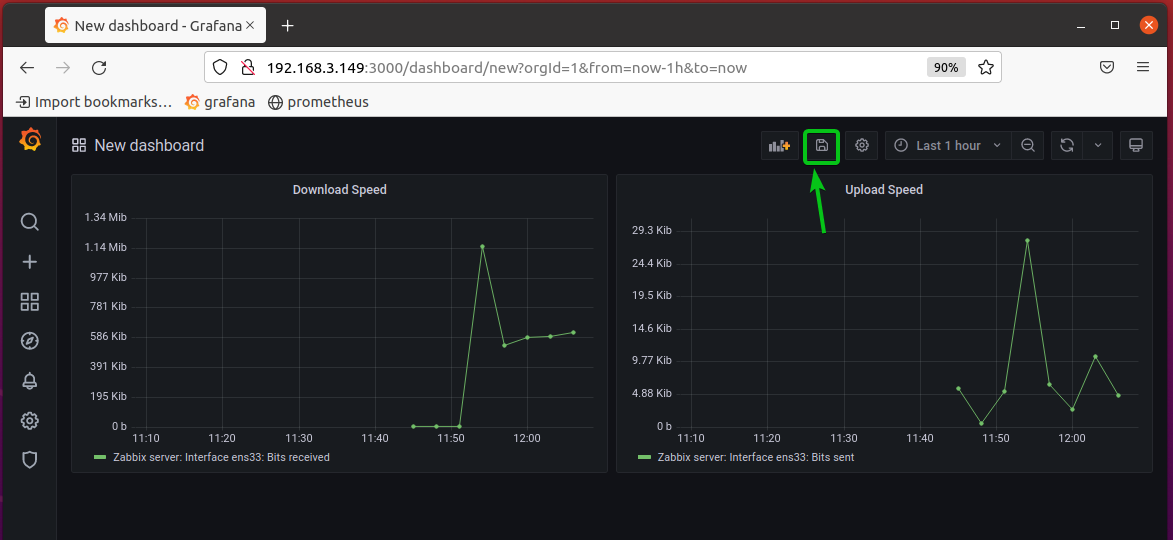
To save the dashboard, click on the save icon ( ) as marked in the screenshot below.
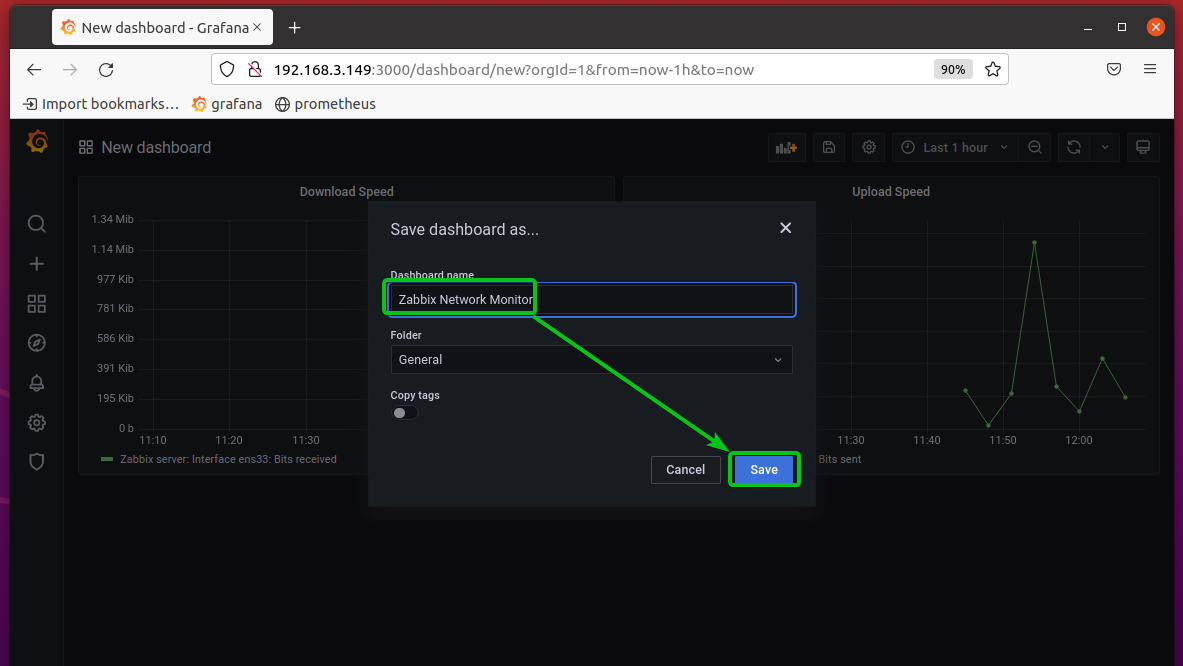
Type in a name for the dashboard and click on Save.
I will call it Zabbix Network Monitor.
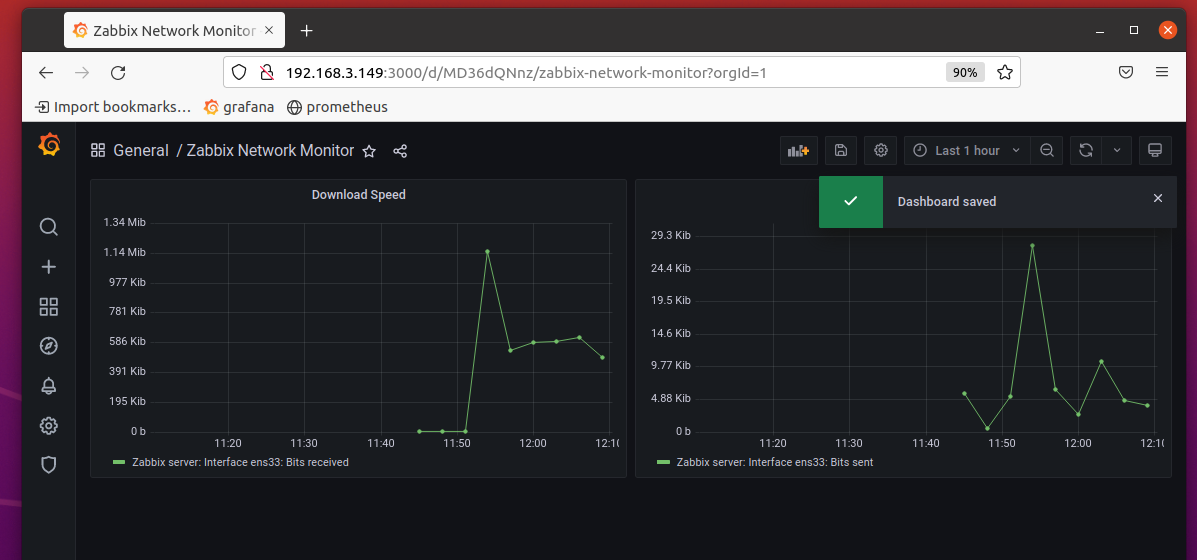
The dashboard should be saved.
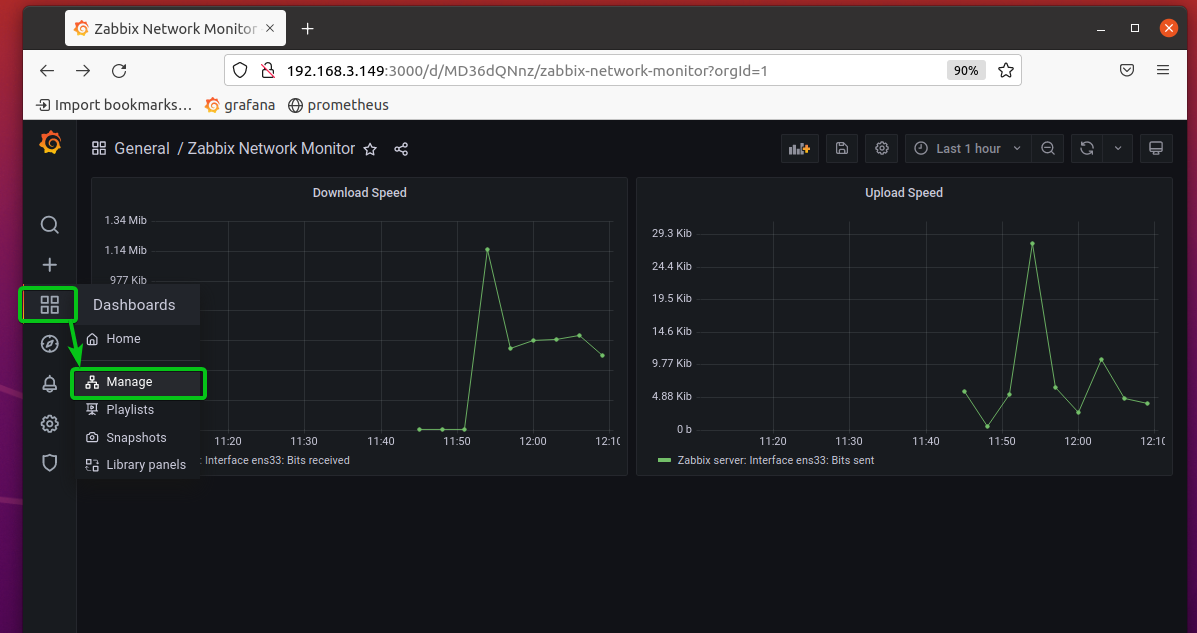
To find a list of all the saved dashboards, click on Dashboards > Manage as marked in the screenshot below.
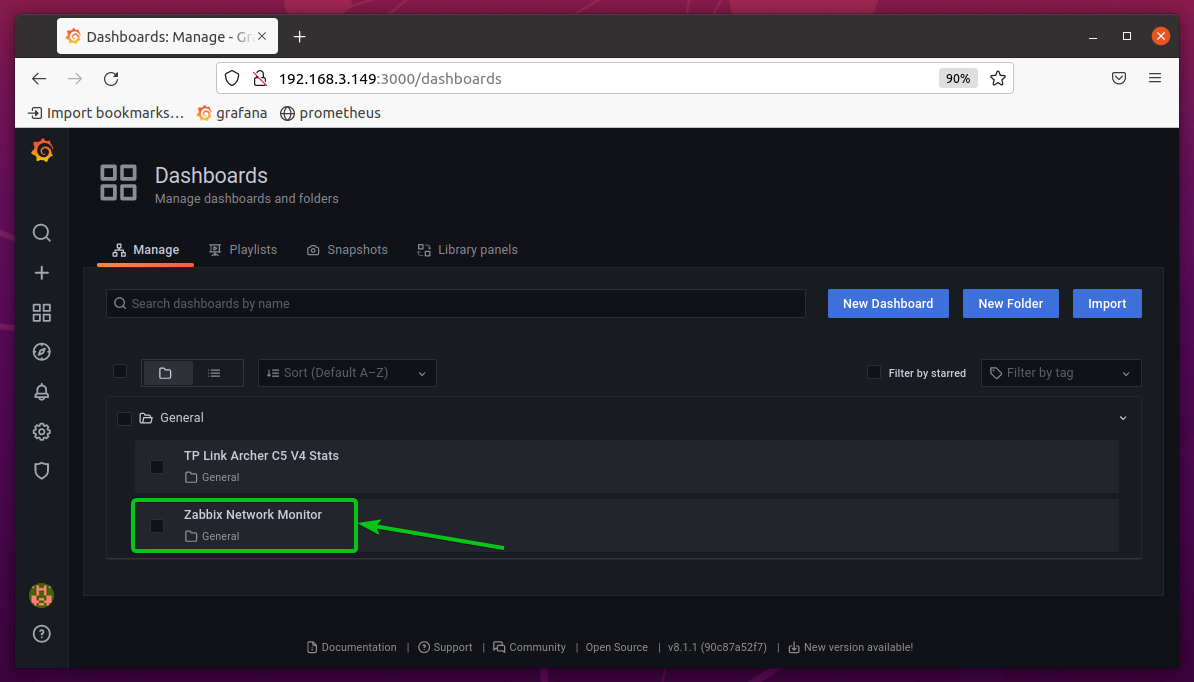
The Zabbix Network Monitor dashboard should be listed here.
To view the Zabbix Network Monitor dashboard, click on it.
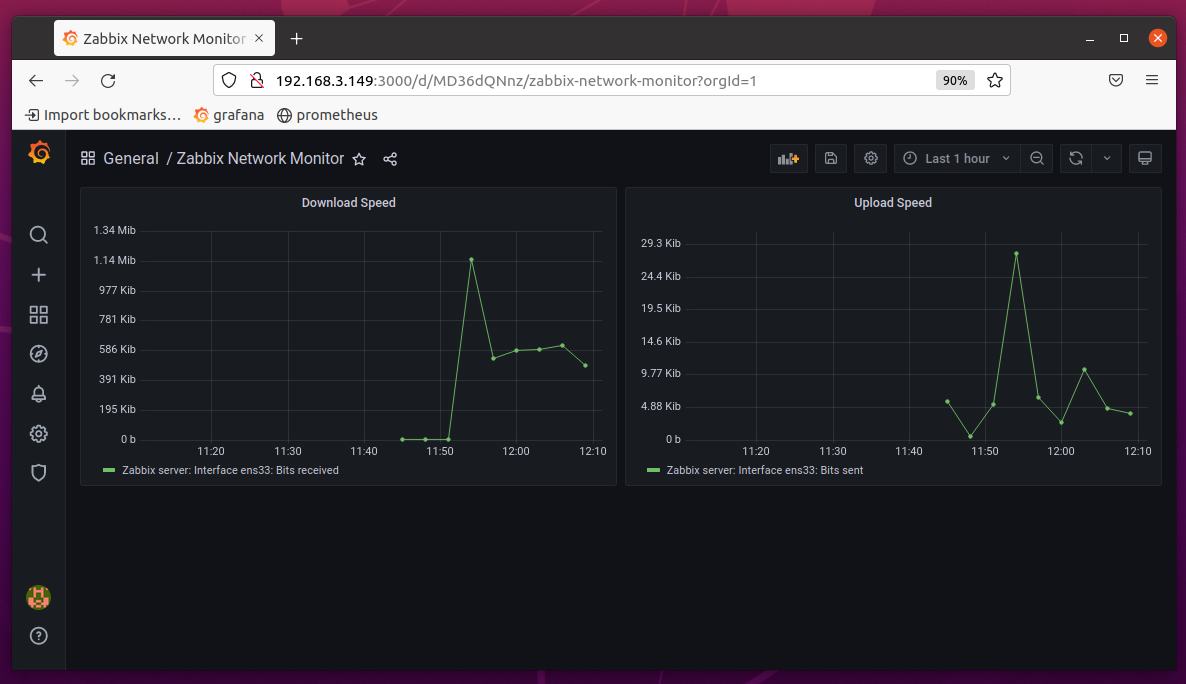
The Zabbix Network Monitor dashboard should be displayed.
Where to Go Next?
To learn more about the Grafana Zabbix plugin, visit the official documentation of the Grafana Zabbix plugin.
Conclusion
In this article, I have shown you how to install the Grafana-Zabbix plugin on Grafana. I have also shown you how to enable the Grafana-Zabbix plugin and add a Zabbix data source on Grafana. I have shown you how to create a Grafana dashboard to monitor the network of a Zabbix server using the Zabbix data source as well.

