
It can help you organize your data and track your system performance in real time, whether you’re a developer, a data analyst, or a system administrator.
This tutorial outlines how to install and configure Grafana on Ubuntu, one of the most popular Linux distributions. We’ll cover the steps on how to install Grafana from the official APT repository and configuring it to run as a system service.
Prerequisites to Install Grafana on Ubuntu
Before you install Grafana on Ubuntu, there are a few prerequisites that you need to make sure are in place. Make sure that your system meets the following requirements:
a. Sufficient Space
First, you need an Ubuntu system with a minimum of 1GB of RAM and 1 CPU core, although more resources are recommended for larger installations.
b. Updated System Packages
Next, you need to ensure that your system has the necessary packages installed and running correctly. You can install these packages using Ubuntu’s default package manager, the apt command. Run this command in the terminal:
Once the update is successful, you will find an output that looks like this:
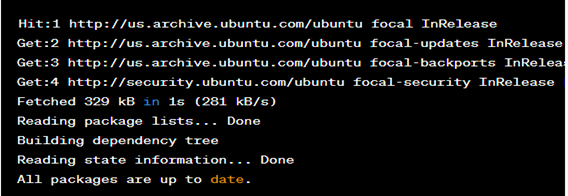
This output indicates that the system has successfully connected to the package repositories and updated the local package index, but no package required updating. If updates were available, they would be listed in the output. You could use the “sudo apt upgrade” command to install them.
c. Install the Curl Package
The curl command-line utility lets you transfer the data from or to a server using various protocols such as HTTP, FTP, and SCP. You can use the following code:
d. Install the Apt-Transport-Https Package
You also need to install the apt-transport-https package which is required to access the repositories over HTTPS. Use the following utility:
A sample output for the code is as follows:
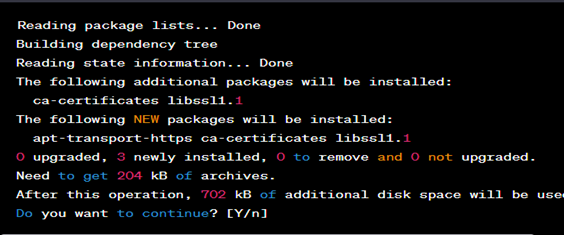
In this sample output, the system checks for available packages and dependencies that are required to install the apt-transport-https. It then prompts you to confirm to proceed with the installation by displaying the “Do you want to continue? [Y/n]” message. You can continue by entering “Y” to download and install the required packages.
How to Install and Configure Grafana on Ubuntu
Once you installed these packages, your system will be ready to proceed with the Grafana installation. If you’re running Ubuntu on a cloud-based platform like AWS or Azure, you may need to open the necessary ports in your firewall to allow the traffic to and from the Grafana server.
The following steps will be critical:
Step 1: Add the Grafana Repository to Your System
The first step in installing Grafana on Ubuntu is to add the Grafana repository to your system. Open a terminal and run the following command to download and add the Grafana GPG key:
Next, add the Grafana repository to your system’s package sources by running the following command:
Step 2: Update the Package Index
Once you add the repository, update the package index by running the following command:
Step 3: Install Grafana
Now, you’re ready to install Grafana. Run this command to install Grafana:
This utility installs Grafana and all its dependencies on your Ubuntu system.
Step 4: Start Grafana
After the installation is complete, you can start the Grafana server by running the following command:
You will receive a result that is similar to what is in the following figure:
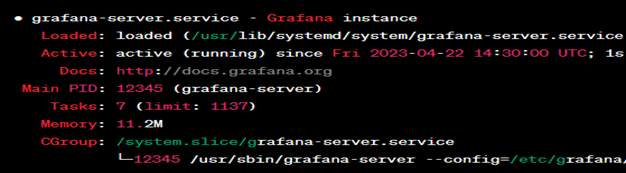
This output indicates that the Grafana service is active and running on the system. You can confirm this by opening a web browser and navigating to the Grafana web interface at http://localhost:3000 (or the IP address or hostname of the server if you are accessing it remotely).
Step 5: Configure Grafana
Once you installed Grafana on your Ubuntu system, the next step is configuring it to run as a system service. This ensures that Grafana starts automatically whenever your system boots up and can be easily managed using the systemctl command.
The following code snippet will help:
This code enables the Grafana server to start automatically at boot time. You can manually start the service by running the following command:
Check the status of your Grafana service using the following command:
If the service is running correctly, you should see a similar output to the following:
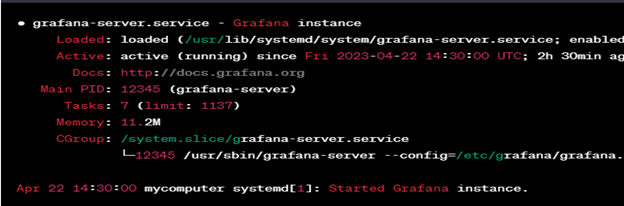
This output shows that the grafana-server service is active and running, with a process ID of 12345. The service started 2 hours and 30 minutes ago, as indicated by the “Active” line. The output also shows the command-line arguments that are used to start the grafana-server process.
The last line of the output confirms that the service started successfully by indicating that the service was “Started.”
Set Up a Reverse Proxy Using Nginx for Grafana
Next, you’ll want to set up a reverse proxy to securely access Grafana over HTTPS. A reverse proxy is a server that sits in front of your Grafana server and handles all incoming requests, forwarding them to the Grafana server over a secure connection.
The following steps are necessary:
Step 1: Install Nginx
You’ll first need to install Nginx on your Ubuntu system to set up a reverse proxy using Nginx. You can use this command:
Step 2: Create a New Server Block
Once Nginx is installed, you must create a new server block in the /etc/nginx/sites-available directory to define the reverse proxy configuration. To do this, run the following command:
This code snippet opens a new file in the Nano text editor. Copy and paste this configuration into the file:
listen 80;
server_name example.com;
return 301 https://$server_name$request_uri;
}
server {
listen 443 ssl;
server_name example.com;
ssl_certificate /etc/ssl/certs/ssl-cert-snakeoil.pem;
ssl_certificate_key /etc/ssl/private/ssl-cert-snakeoil.key;
location / {
proxy_pass http://localhost:3000;
proxy_set_header Host $host;
proxy_set_header X-Real-IP $remote_addr;
proxy_set_header X-Forwarded-For $proxy_add_x_forwarded_for;
}
}
Replace example.com with your IP address or domain name, and adjust the SSL certificate paths if necessary. This configuration sets up a redirect from HTTP to HTTPS and forwards all requests to the Grafana server that is running on localhost:3000.
Save and close the file. Press Ctrl+X, followed by Y and Enter to achieve this.
Step 3: Create a Symbolic Link
Next, create a symbolic link to the new server block in the /etc/nginx/sites-enabled directory which enables it to be used by Nginx:
Step 4: Restart the Nginx Web Server
Finally, restart Nginx to apply the new configuration. Use the following code:
You should now be able to access Grafana securely over HTTPS by navigating to https://example.com (or your domain name or IP address) in a web browser. But this only happens if you correctly set up the reverse proxy and configure Nginx to serve the Grafana files.
Conclusion
You should now have a functional Grafana on your Ubuntu machine. Besides, you have successfully set up a reverse proxy using Nginx to access Grafana securely over HTTPS. You can now add the data sources, create the dashboards, and set the alert system.