The tutorial shows how to install Grafana Enterprise and Grafana Beta in Debian-based Linux distributions. This choice is made in the first step.
All instructions explained in this article include screenshots, making it easy for all Linux users to follow them. After all, installing it is pretty simple by following a few simple steps.
How to Install Grafana in Debian
This section explains how to install Grafana in Debian using apt/apt-get.
You need to execute only one of the first two commands below. If you want the Enterprise edition, execute the first command and ignore the second. Execute the second command if you want the beta version and ignore the first one. It is recommended to install the Enterprise edition to avoid bugs.
To begin installing Grafana in Debian, add the Grafana repository by running the command below:
NOTE: If you want Grafana Beta, execute the command below instead.
DO NOT EXECUTE THE COMMAND BELOW IF YOU WANT THE ENTERPRISE RELEASE.
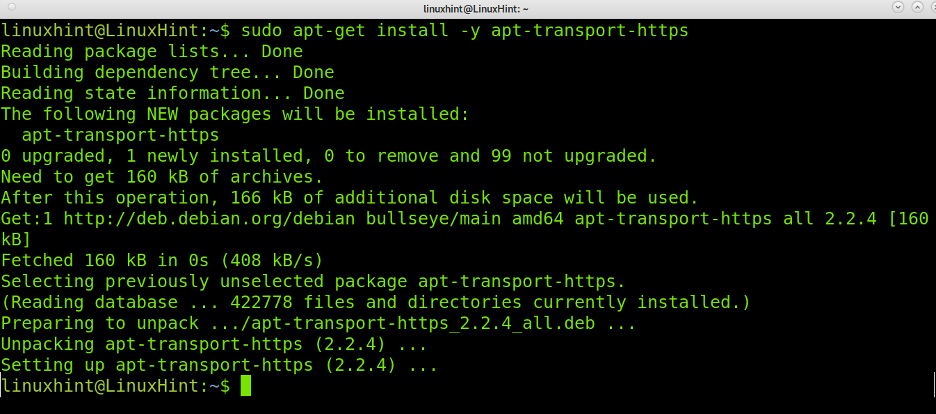
Install the following needed packages using apt or apt-get, as shown below:
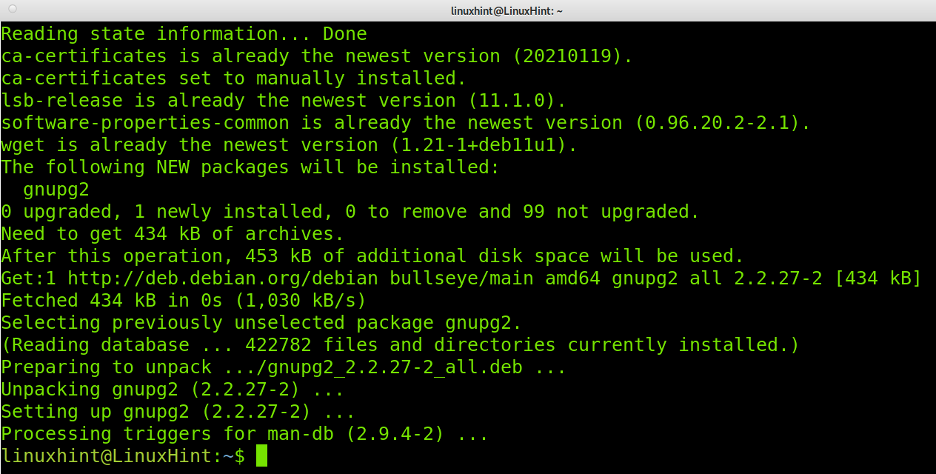
Also, install the following packages:
Then, run the following command to add the last dependencies:
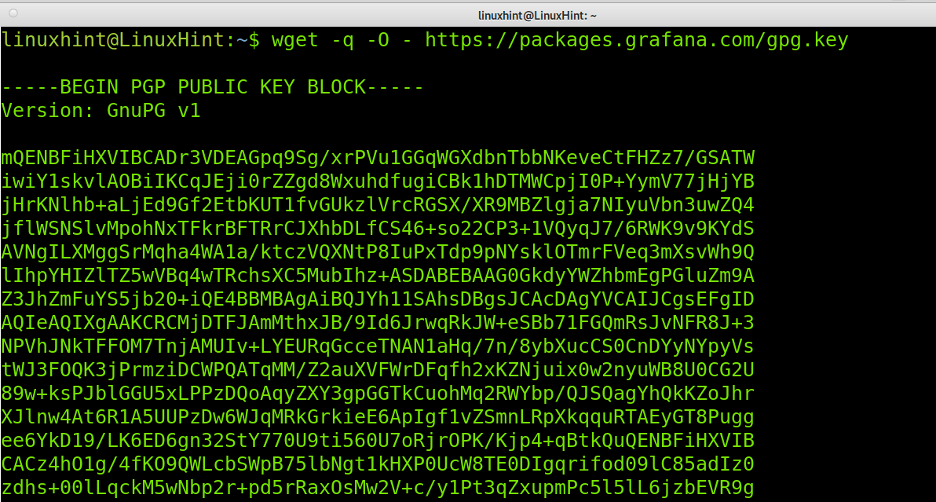
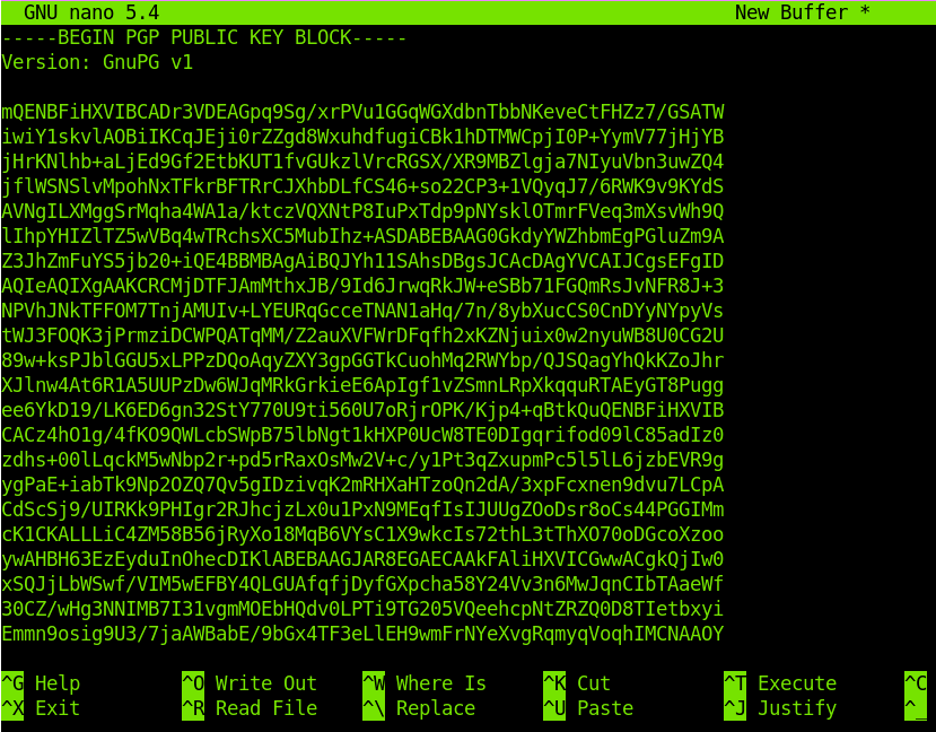
Now, you need to get Grafana’s GPG key. To get the key, run the command shown in the following image:
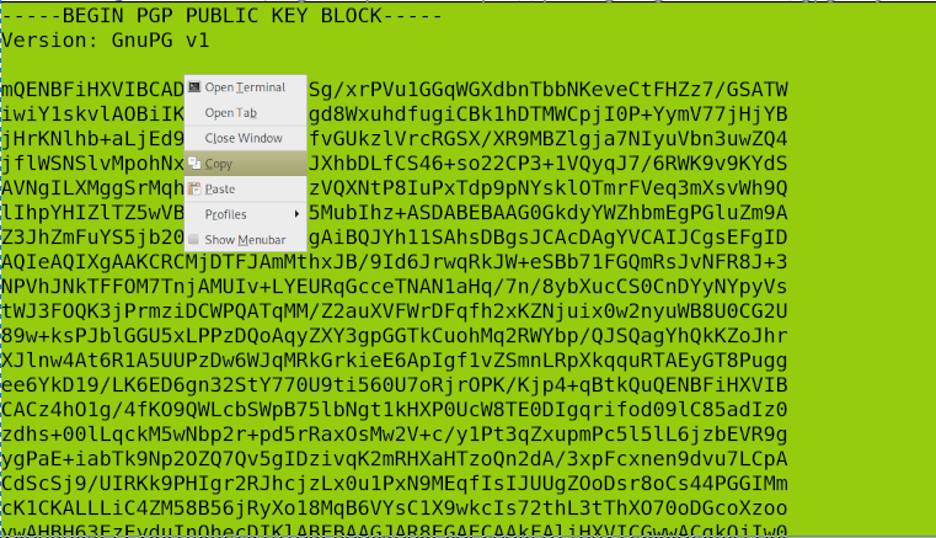
Copy the entire key as shown below. Copy from and include —–BEGIN PGP PUBLIC KEY BLOCK—– to continue until —–BEGIN PGP PUBLIC KEY BLOCK—–
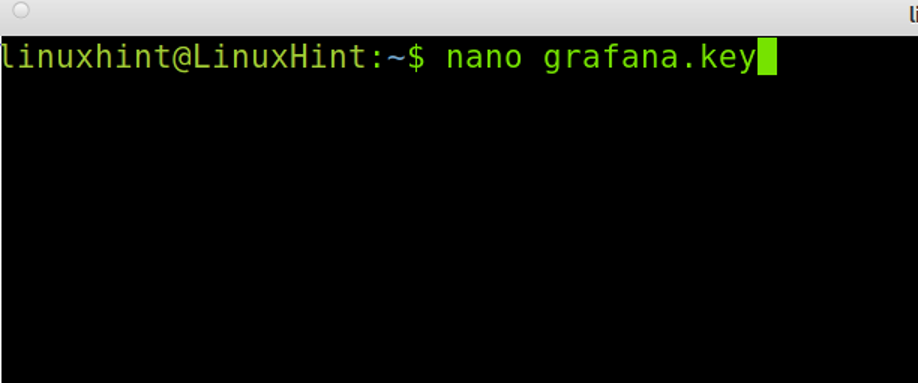
Create a file named grafana.key using the command below:
Paste the GPG key in the file, and save it by pressing CTRL+X and Y.
From the key, create a GPG file by running the command shown below:
Install the GPG key to be added to the /etc/apt/trusted.gpg./d/ directory.
Update repositories by running the following command:
Now, install Grafana, as shown below:

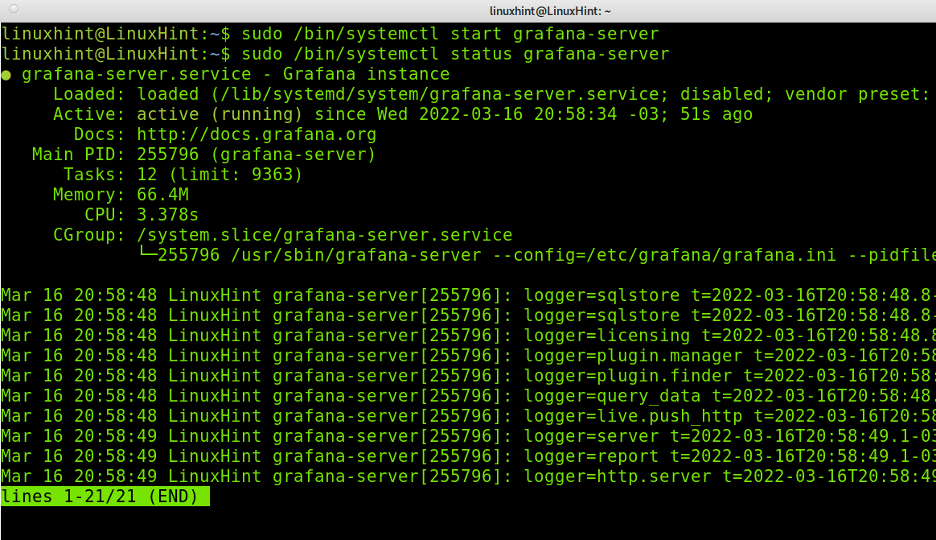
Once the Grafana server has started, you can access it through the URL
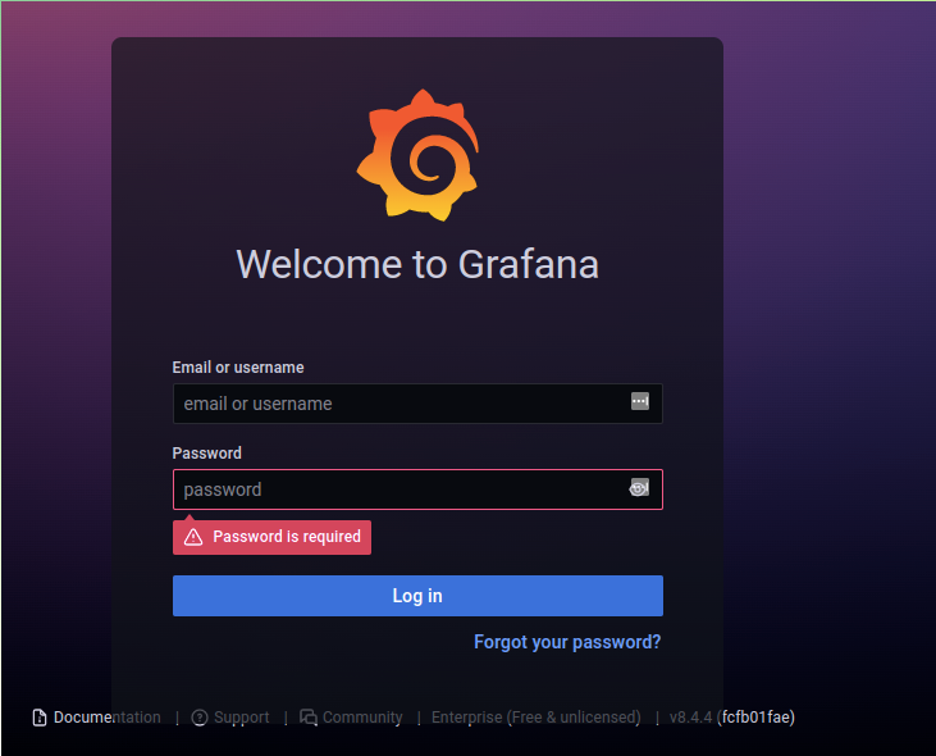
Grafana’s default user and password are “admin” and “admin”. After you log in to Grafana, you will be required to change it.
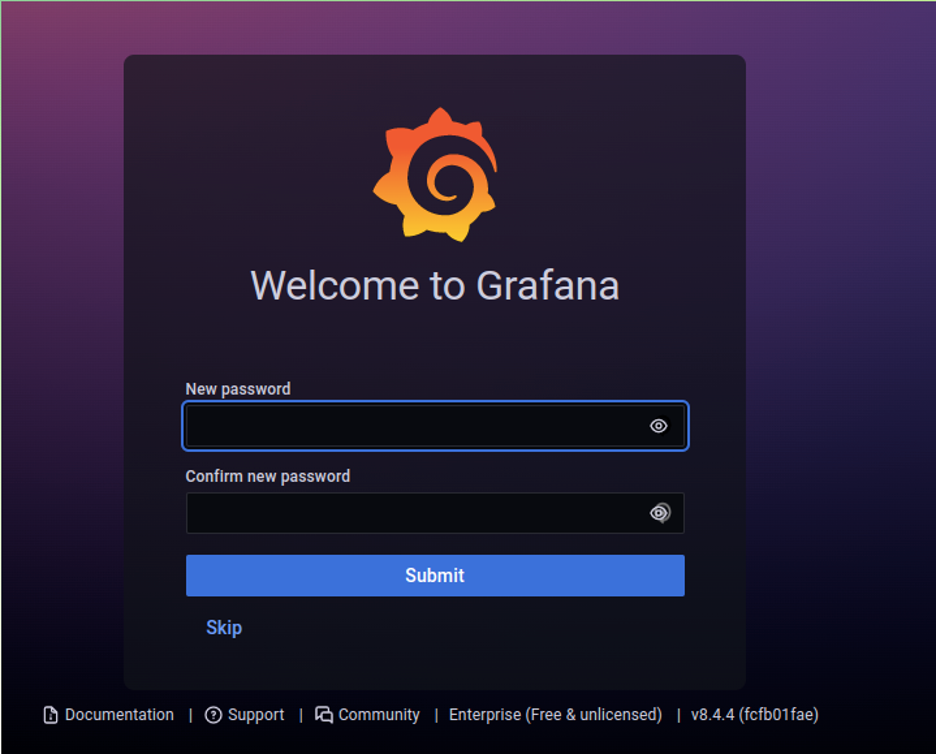
The first step after logging in requires you to update your password, type a secure password and then press the Log in button.
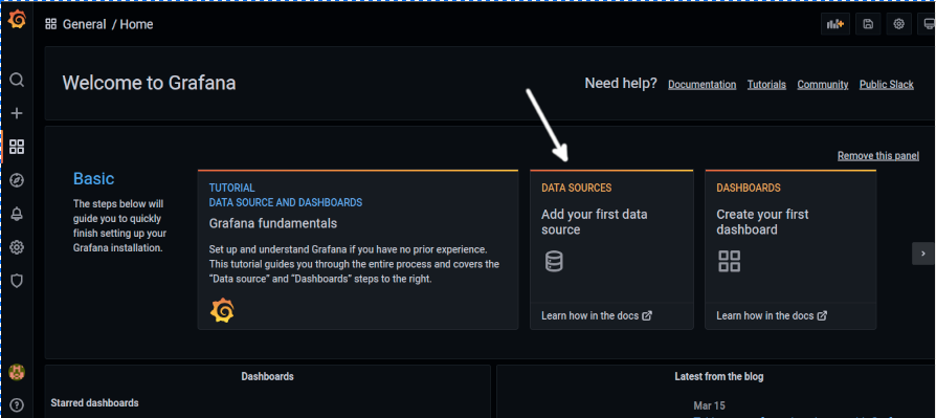
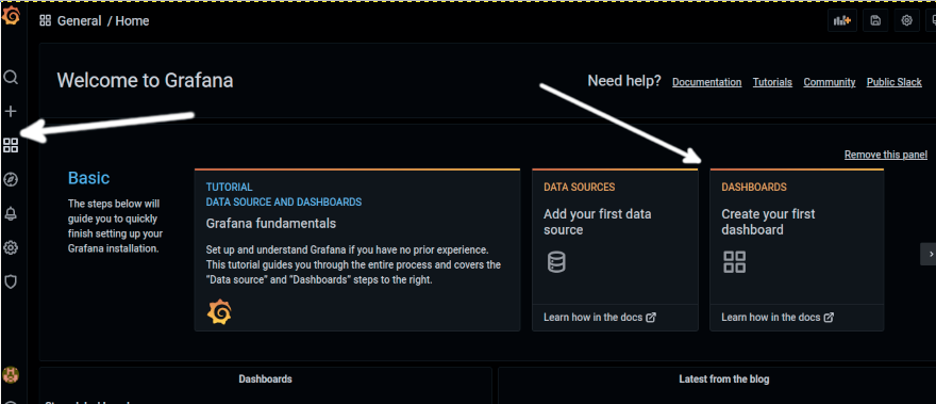
Here’s Grafana’s first screen as shown below. You need to create at least a data source and dashboard.
Data Sources are a series of plugins allowing you to connect to external sources like Google Cloud services or databases.
To create data sources, press the DATA SOURCES option as shown below (White arrow):
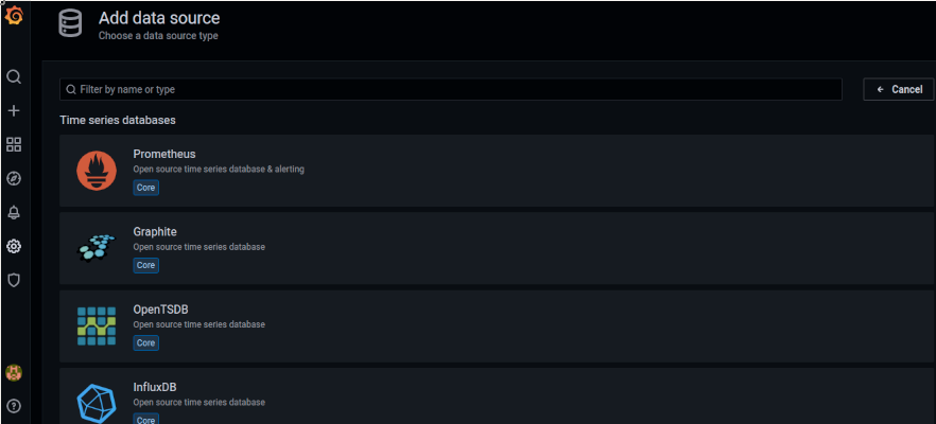
As you can see in the image below, you have a large amount of available data sources. You can scroll down or use the search box to find the one you need.
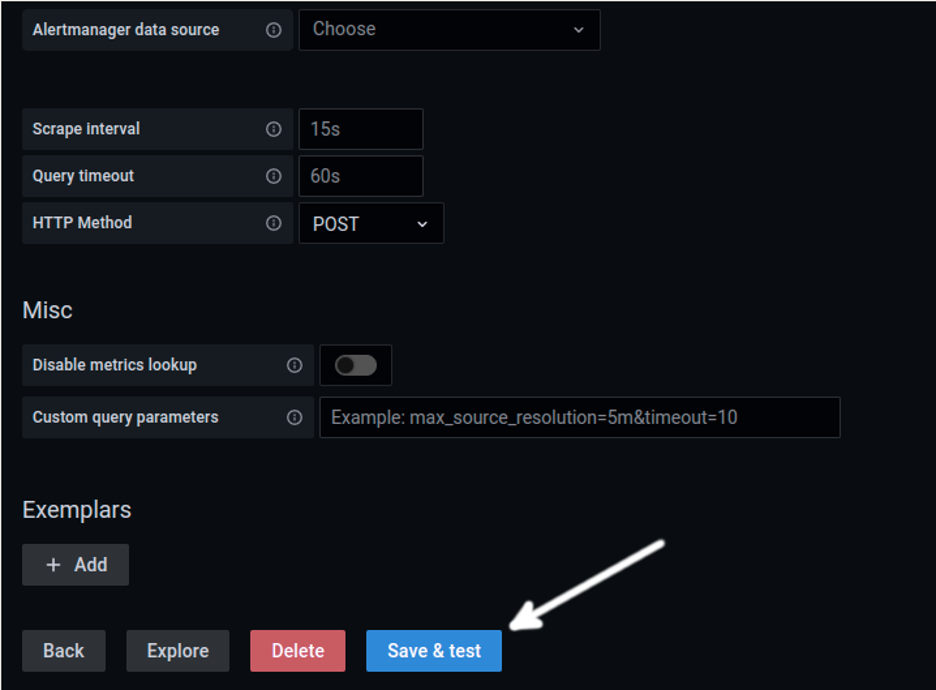
Select the source you want to use, fill the fields required in the screen shown below, and press the Save & test button:
NOTE: You can find instructions for each data source at https://grafana.com/docs/grafana/latest/datasources/.
Grafana allows you to create and customize your dashboards with custom panels. Display properties are fully customizable to show the data according to your needs. The displayed data is received through a large number of available data sources.
To create a dashboard, press the main screen button in the left menu, and press DASHBOARDS.
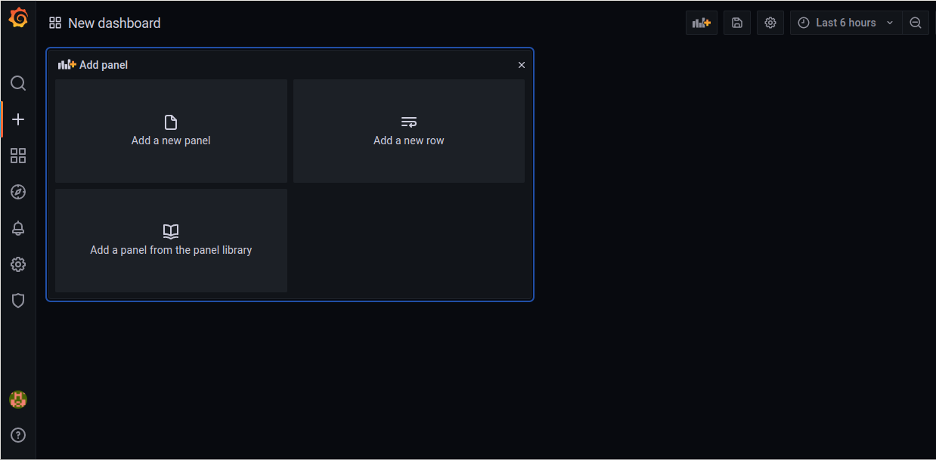
The dashboard creation page allows you to add new panels, rows and use panels from a library. You can create as many dashboards as you want.
Configure the data sources before starting with panels. You can add many data sources to a unique dashboard by adding panels.
Grafana Alternatives
The market offers a variety of alternatives to Grafana you can try, some of which are the following:
- Dynatrace: Another fully automated monitor which also provides answers based on the insights of every user or transaction.
- DataDog: Another monitor tool for Dev and Ops writing applications at a large scale and need to process large amounts of data.
- Prometheus: While it can be integrated into Grafana, Prometheus is another open-source monitoring tool for databases.
- LogicMonitor: A SaaS-based monitoring tool with an automated performance analysis platform providing Ops with actionable visual metrics.
- Centreon: This is another open-source alternative to monitor and analyze data.
As you can see, there are many alternatives to Grafana you can try. Yet, Grafana is becoming one of the most popular data collection and analysis tools.
Conclusion
As you can see, the installation process in Debian-based Linux distributions is pretty simple and can be done by any Linux user.
Gafana is a formidable tool to keep updated on important information, statistics, or data analysis. It has an excellent virtual interface since you can fully customize it and create a variety of visual options. Grafana is also widely supported, permanently increasing the plugin library. Some of the supported data sources include MySQL, PostgreSQL, Microsoft SQL and more databases; you can also configure it using APIs provided by many data sources. You also can download additional plugins from https://grafana.com/plugins.
We hope you found this tutorial on installing Grafana in Debian helpful. As you can see, the installation process is pretty simple and can be done by any Linux user. Check the other Linux Hint articles for more tips and tutorials.


