Psensor is a graphical application for monitoring hardware sensors present in your Linux computer. It can read temperature values in Celsius / Fahrenheit and fan speeds in RPM. You can also enable and tweak alarm notifications when critical values are reached. Psensors also supports logging of sensor values and an option for monitoring CPU and memory usage. This article will cover installation and configuration of Psensor in a Linux distribution.
Installing Psensor
It is recommended that you install the “lm-sensors” package first before installing psensor to enable extended support for reading various sensors built into the hardware. Run the command below to install lm-sensors in Ubuntu:
You can search for the term “lm-sensors” in package managers of other Linux distributions.
Once lm-sensors package has been installed, run the command below to enable detection of sensors:
Follow the on-screen instructions and enter your answers after carefully reading each question. When you are asked to “automatically add lines”, choose yes. Once you are through the command line wizard, reboot your system and run the command below to view sensor information in a terminal:
Now to install psensor in Ubuntu, run the command below:
Packages for other Linux distributions are available here (scroll down).
First Run Setup
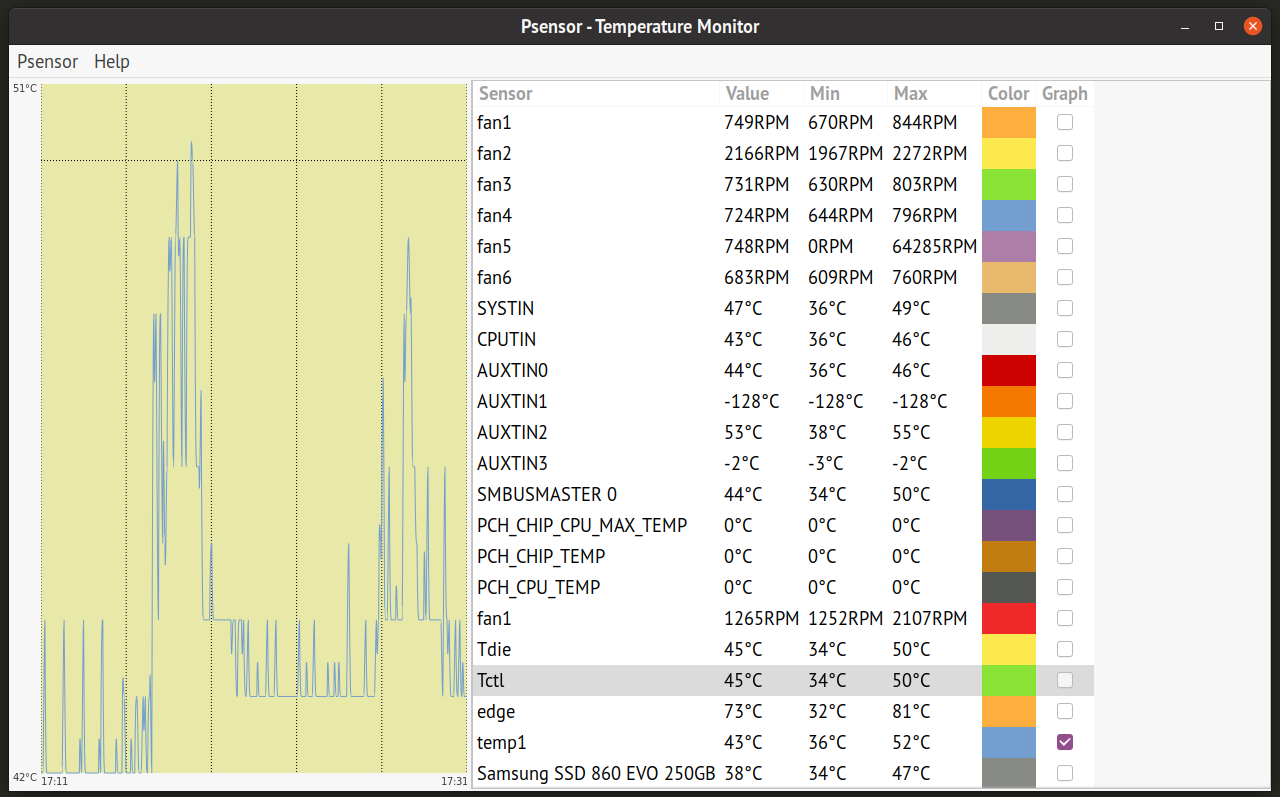
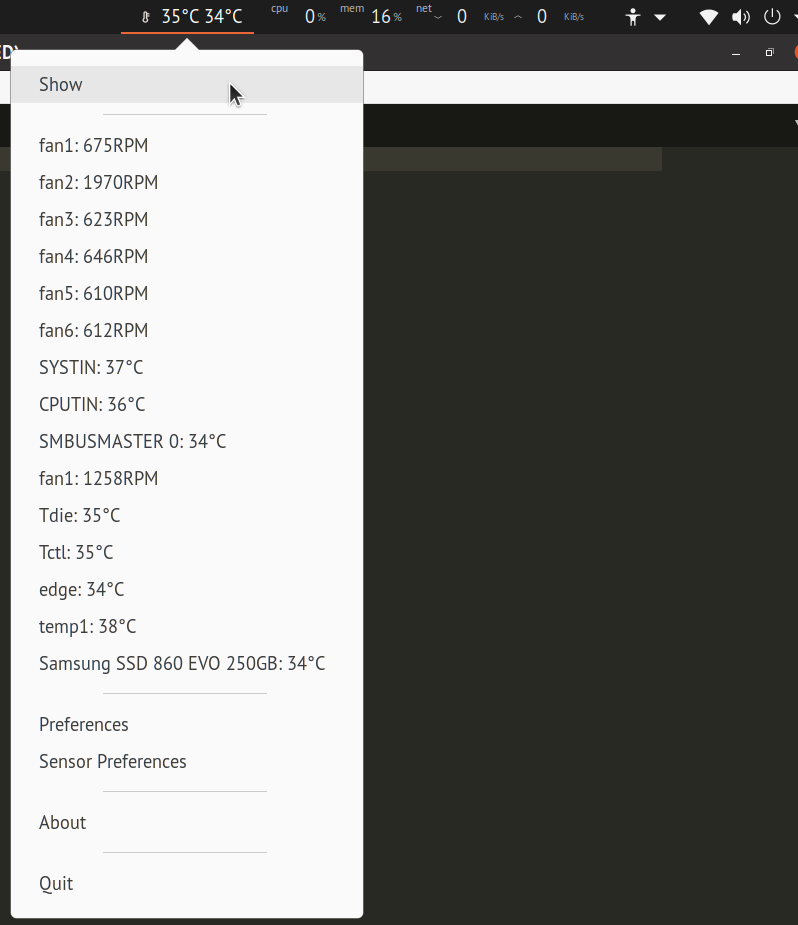
Launch “Psensor” from the application launcher to start the app. You will be presented with a window showing various graphs, sensor readings and threshold values. You will also get a system tray icon for quick access to menu options and current readings.
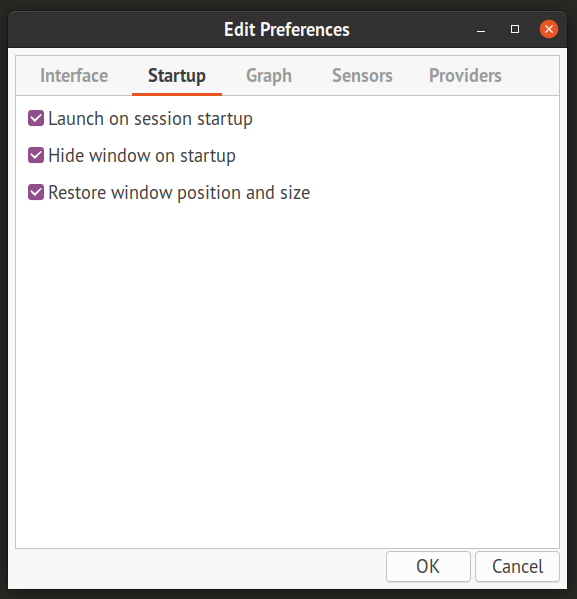
Now there are two things you might want to configure to tweak the behaviour of the Psensor app. First, you may want to disable the graphical window so that it doesn’t appear everytime you run Psensor. To do so, go to preferences and check the “Hide window on startup” checkbox in the “Startup” tab. To manually view the graphical window, you can use the “Show” option in the system tray icon.
Secondly, you may want to automatically launch Psensor in every session. In the same “Startup” tab, you will find another checkbox “Launch on session startup”. Check it to launch Psensor automatically on every boot.
Enable CPU and Memory Usage Monitor
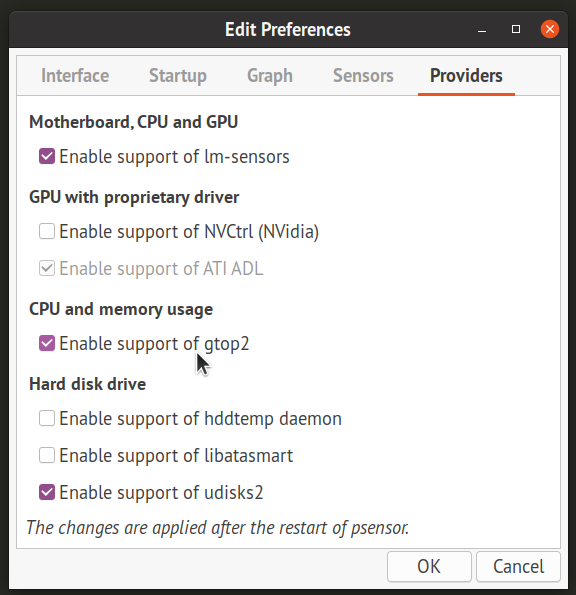
Apart from the hardware sensors, you can also enable indicators for CPU and memory usage. To do so, go to Psensor “Preferences” and click on “Providers” tab. Under “CPU and memory usage” heading, check “Enable support of gtop2” checkbox. Close the existing instance of Psensor and relaunch the app. You should now have two additional indicators in the system tray dropdown menu. You can also make them appear in the system tray label itself (explained in the section below).
Configuring Individual Sensors
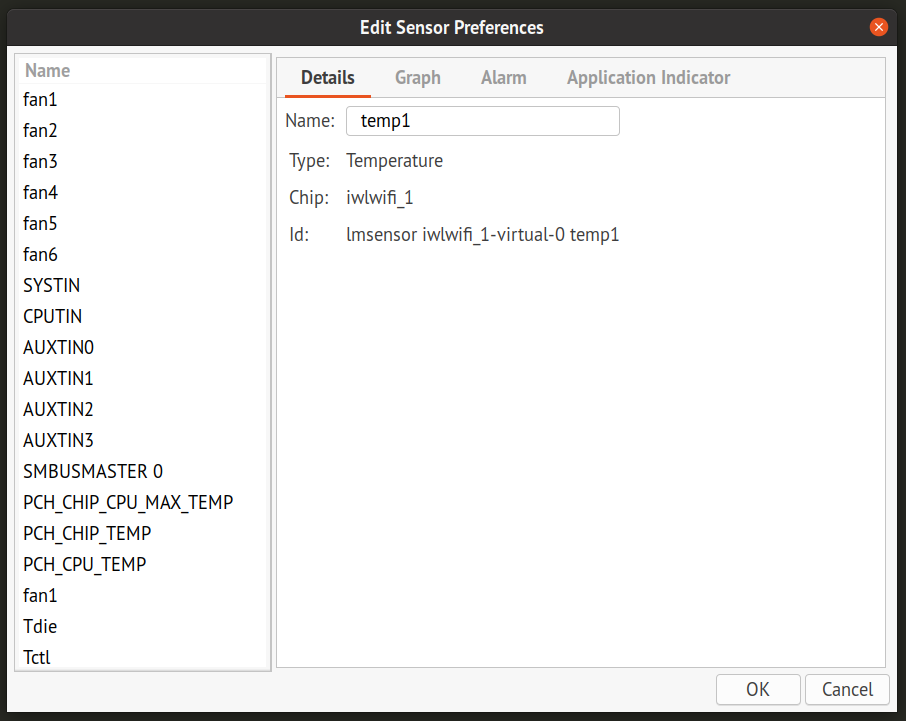
Click on “Sensor Preferences” entry in the system tray or in the “Psensor” dropdown menu in the graphical window. Here, you can customize behavior of each sensor and change their visibility in the system tray dropdown menu, enable graphs and tweak alarm notification thresholds. You can also rename them and change their order by dragging and dropping individual entries. Items constantly updated and directly visible in the system tray icon (not in the dropdown menu) can also be toggled in the “Application Indicator” tab.
Conclusion
Psensor is a comprehensive app for monitoring hardware sensors and other system statistics. It provides numerous options to tweak the behavior of sensor indicators and monitors, and can be used on both desktop PCs and web servers. To monitor a remote server, you can use Psensor’s web interface. Read more about it and its security implications here.

