With the vast number of features of AWS, there is also a feature that lets the user check the memory utilization of Elastic Compute Cloud. The Memory utilization of the AWS EC2 service can be checked through the “CWAgent” metrics in the AWS CloudWatch Console. But, the “CWAgent” is not enabled itself. The user needs to enable it by associating an instance with the “CloudWatchFullAccess” role and performing some operations through an EC2 virtual machine connection.
Let’s discuss how to check memory utilization in AWS EC2 from scratch.
How to Check Memory Utilization in AWS EC2
As mentioned earlier, “CWAgent” is the service through which users can check and monitor the memory utilization in AWS EC2 through AWS CloudWatch. For that, the “CWAgent” option must be enabled. Follow the steps to enable the option and then use it to check EC2 memory utilization.
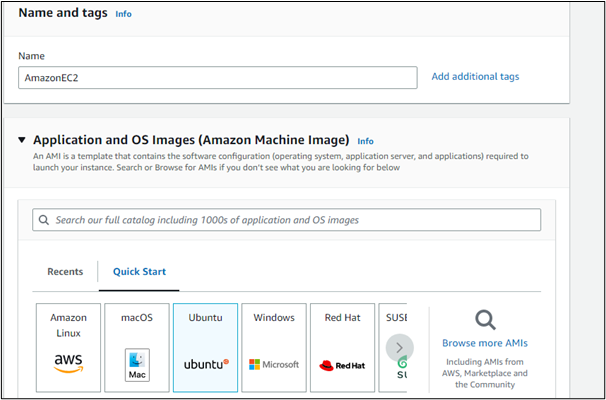
Step 1: Launch an Instance
The user must launch an instance first if there is no instance already. Configure the settings for the EC2 instance and select an AMI to execute commands through a particular virtual machine on the EC2 instance. For example, here we select “Ubuntu” as the AMI:
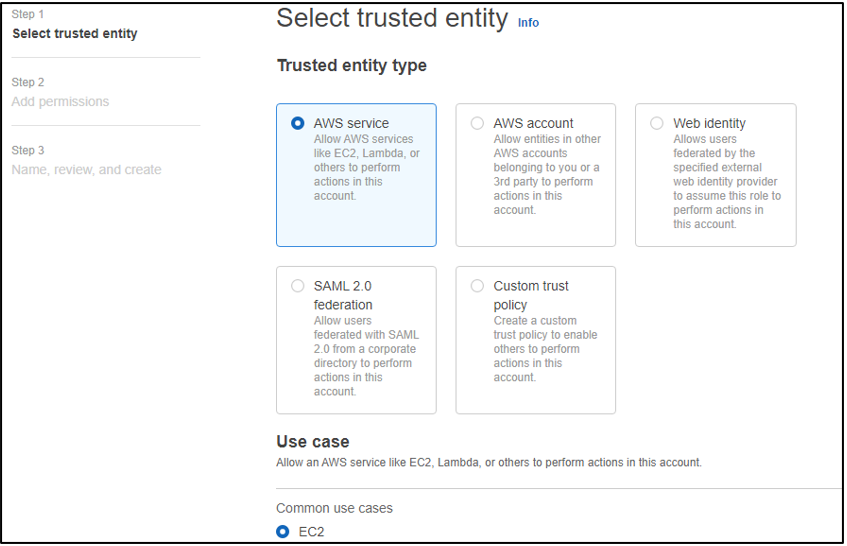
Step 2: Create an IAM Role
The second step is to create an IAM role, and for that, simply open the IAM management console and create a new IAM role. Give access to the AWS service and select ec2 as the use case:
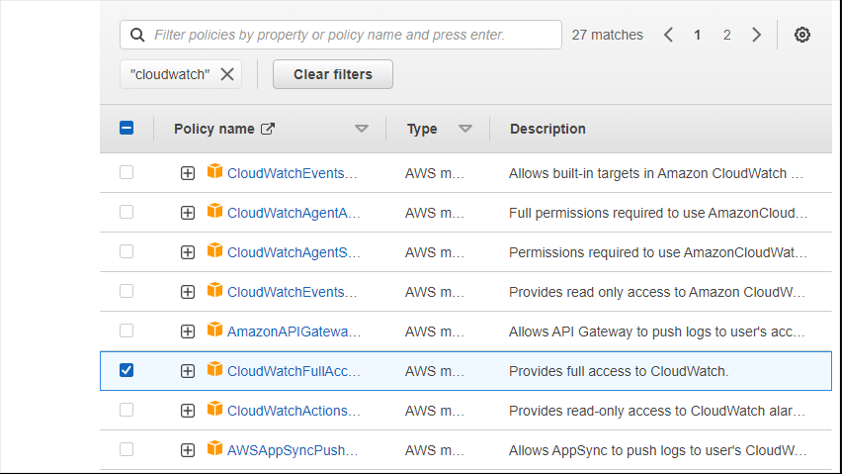
Select “CloudWatchFullAccess” as the permission:
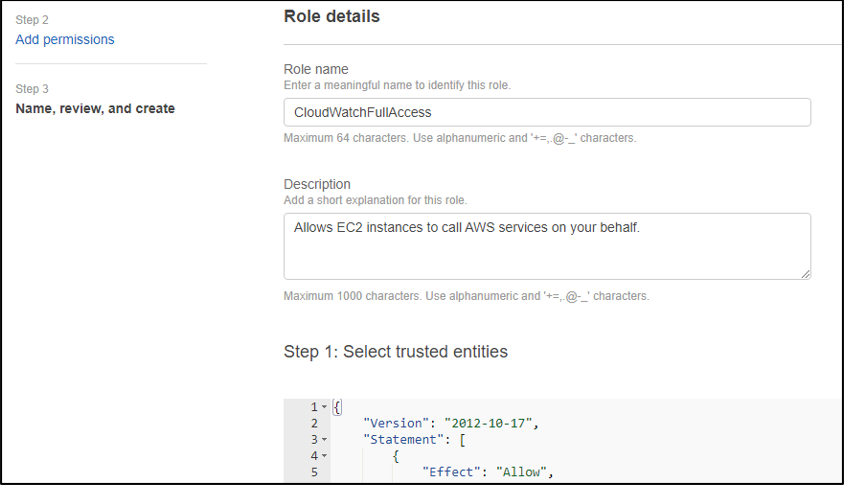
Type a Role name and write a description:
In this way, the role is created:

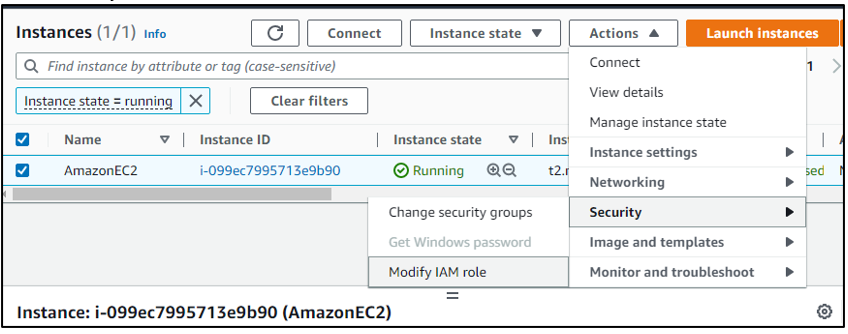
Step 3: Modify the IAM Role
The user must now connect and associate the role with the EC2 instance. Select the instance and click on the “Actions” button and in the dropdown of the “Actions” button, select security and then click on the “Modify IAM Role”:
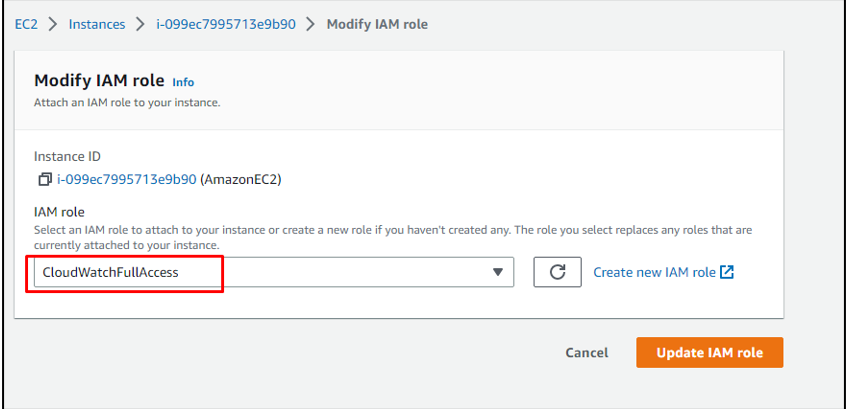
Now, select the role with cloud watch access and click on the “Update IAM role” button:
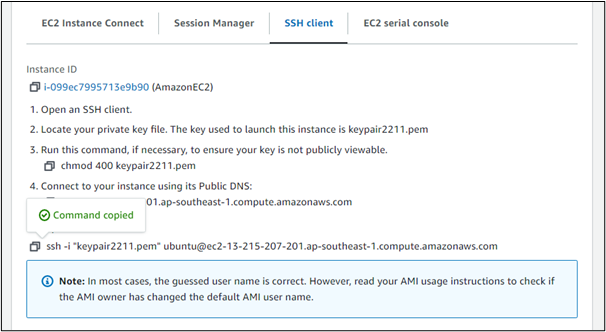
Step 4: Connect Through SSH
Now establish an SSH connection on the virtual machine selected as the AMI by simply copying the SSH command for the instances “Connect” section and pasting it to the command line interface:
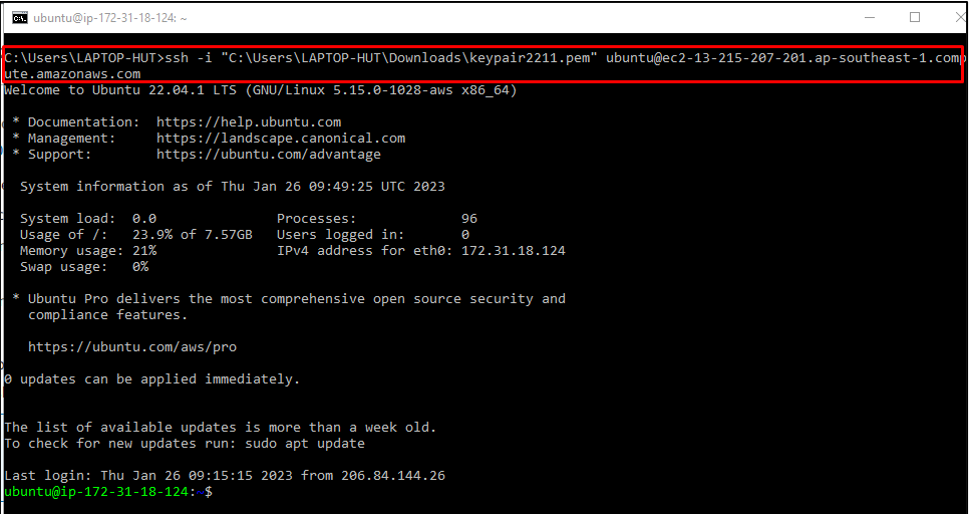
Use the “pem” format key pair files’ exact location on the system rather than the name of the file while pasting the SSH command in this way, the ubuntu virtual machine is enabled and is ready to execute commands:
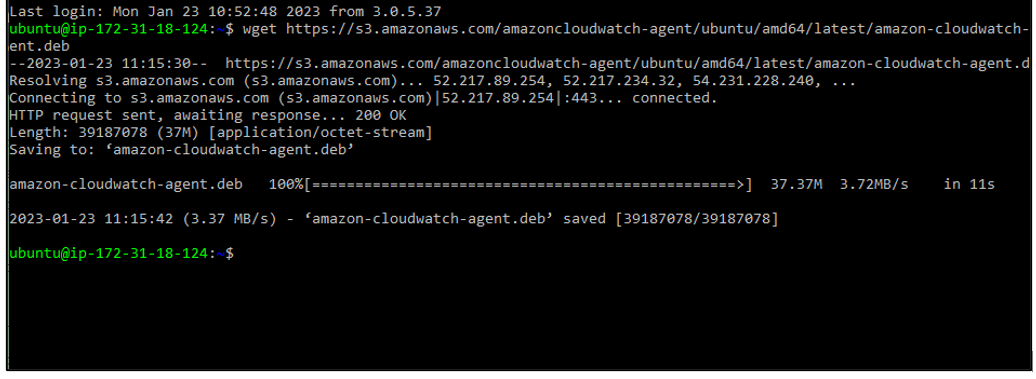
Step 5: Download CloudWatch Agent Files
To download the amazon file required to monitor the EC2 usage, type the command:
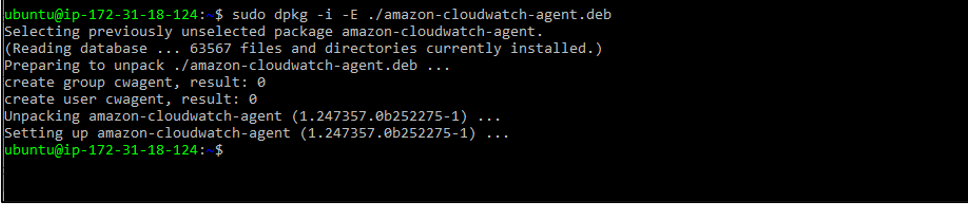
To unpack and set up the file, use the command:
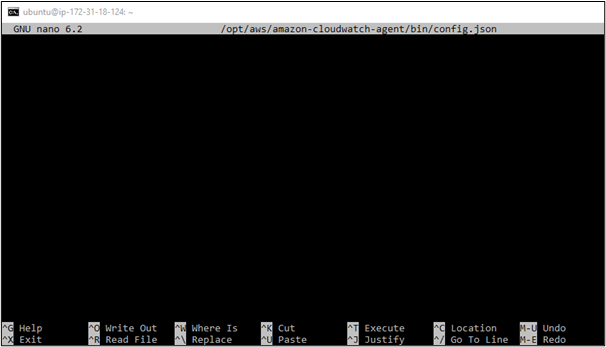
After that, the next step is to configure the JSON file, for that, use the following command:
Step 6: Add Code to the File
Add the following configuration code to the file:
"metrics":{
"metrics_collected":{
"mem":{
"measurement":[
"mem_used_percent"
],
"metrics_collection_interval":60
}
},
"append_dimensions": {
"InstanceId": "${aws:InstanceId}"
}
}
}
In the code above, “60” represents that the CWAgent will send information after every 60 seconds after the successful configuration through CLI. The user can change it to any other interval:
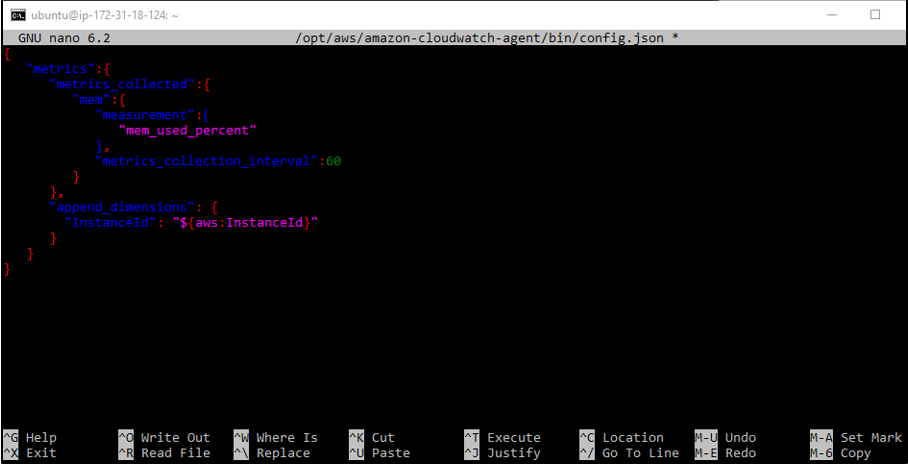
Once the code has been copied/written to the configuration file. To save the file, the keys used are “CTRL + O”. And, to exit from the file, press “CTRL + X”.
Step 7: Start the CloudWatch Agent
After downloading, configuring, and saving the file, the user has to start the CloudWatch agent and to do so, there is the following command that will start the CloudWatch Agent (CWAgent) in the AWS CloudWatch Management Console:
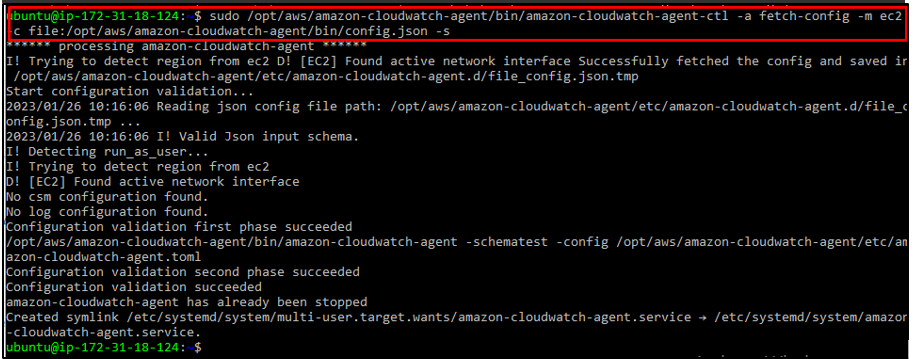
The Configurations have been completed. Now move on to the AWS console for the next steps.
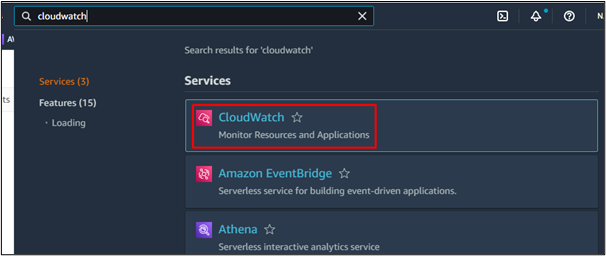
Step 8: Open the CWAgent Metric
The user has to open the CloudWatch Management Console:
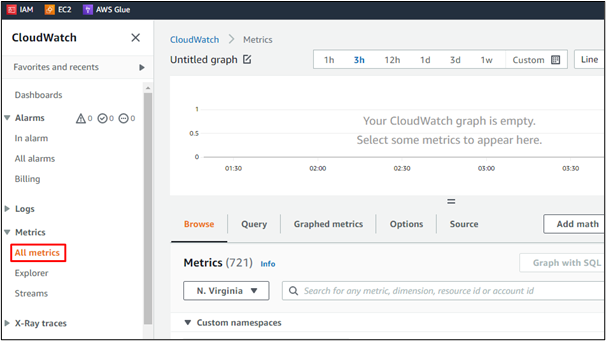
In the CloudWatch Management Console, select the “All metrics” options:
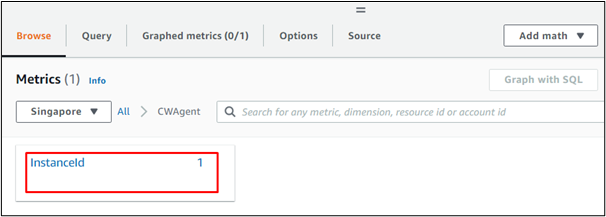
“CWAgent” will appear in the “Browse” section. Simply click on that:

Note: If the CWAgent doesn’t appear in the metrics, then wait for the set interval period. After the initial duration of the interval has elapsed, the “CWAgent” appears in the CloudWatch metrics.
This will display the “InstanceID” option. Click on that:
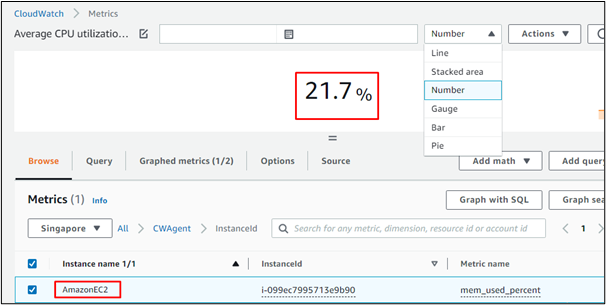
This will ultimately display the memory utilization in the user-defined form. For instance, selecting the “Number” option as the output type of memory utilization will display the memory utilization in percentage. The details of the connected EC2 instance will also appear:
This was all about how to monitor memory utilization in AWS EC2.
Conclusion
Memory utilization in the EC2 instance can be checked and monitored through the “CWAgent” option in the list of metrics of the CloudWatch service. The user has to first enable the “CWAgent” option in the metrics of the CloudWatch through the Command Line Interface and then use the “CWAgent” to check the memory utilization.